


Build your audience with News Consumer Insights
Get data-driven recommendations for your site
Get recommendations for your site from News Consumer Insights
News Consumer Insights analyzes your Google Analytics data to give you actionable recommendations tailored to your site to inform your audience engagement and revenue strategy.
Get actionable recommendations on:
- Reader Engagement
- Reader Revenue
- Video Insights
Looking for video insights? Check out our Lesson on Video.
To use News Consumer Insights, you need a Google Analytics account.
- Go to News Consumer Insights.
- Select Authorize.
Select your Google Analytics account.
How is my audience segmented
News Consumer Insights segments your audience based on how often they visit your site across a 30 day period.
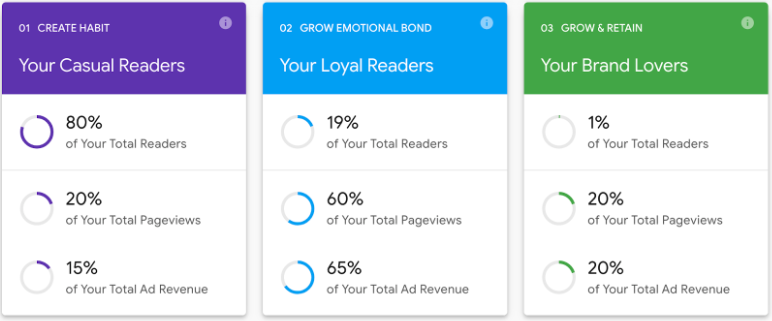
- Casual Readers are your newest audiences, visit your site once
- Loyal Readers visit your site 2-14 times
- Brand Lovers visit your site 15+ times
Together, these three segments make up your funnel. The end goal is to move readers across the funnel – turn the casual readers into brand lovers.
Not all audiences behave the same way. Loyal Readers and Brand Lovers only make up about 20% of a publisher’s audience, but make up 80% of the total pageviews. In other words, focusing on 20% of your audience can give you 80% of your results.
Understand your audiences so you can tailor your audience strategy, select the audiences to focus on, and allocate resources accordingly.
Which audiences should I focus on?
Identify which audiences to focus on by seeing an overview of each audience segment and comparing their engagement.
STEP 1
Go to Reader Engagement
STEP 2
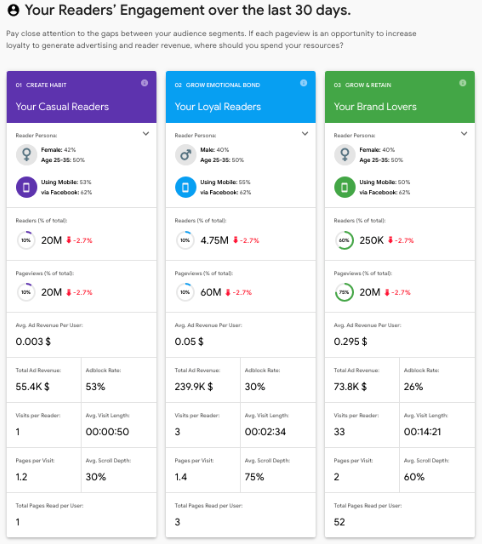
See who your Casual Readers, Loyal Readers, and Brand Lovers are:
- What are their demographics?
- How do they access your site?
- How much ad revenue do they bring in?
- How engaged are they?
- How often do they visit?
STEP 3
Click View Recommendation to see the top best practice you can use to improve.
Where are my audiences coming from?
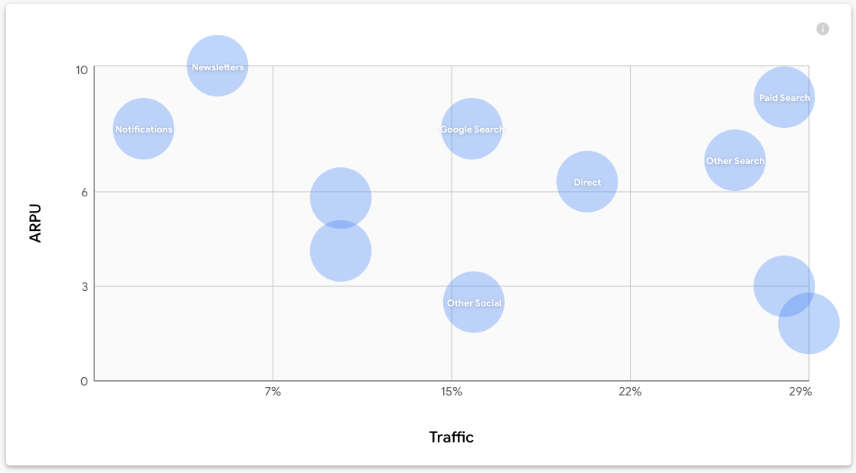
Traffic Sources shows where audiences come from, such as:
- Direct
- Search
- Social (Facebook, Twitter)
- Newsletters
- Referrals
Audiences are displayed on a graph comparing percent of traffic to pages read per person.
STEP 1
Go to Reader Engagement and scroll down to Traffic Sources.
STEP 2
Hover over a blue bubble to see what percent of your audience is coming from that source.
If <1% of your traffic comes from a source, a blue bubble will not display.
STEP 3
Click View Recommendation to see how to grow each source of traffic.
💡Best practice: Focus on increasing traffic from sources that appear in the top right, as they bring in the most traffic or revenue.
How am I doing compared to other news organizations?
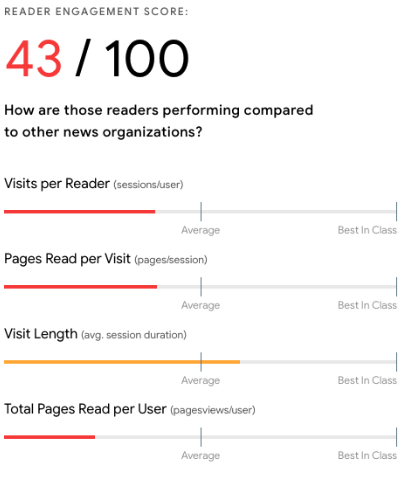
See how your audience engages compared to other news organizations’ with our Reader Engagement Score (RES). RES ranges between 0 and 100; 50 is the industry average.
Reader Engagement Score helps you
- Compare engagement metrics for your audience’s visits and pages read against industry averages
- Understand what drives engagement, so you can decide where to focus
To see your Reader Engagement Score
STEP 1
Go to Reader Engagement
STEP 2
Scroll down to Reader Engagement Score, where you can see your audience by device and engagement.
STEP 3
Click View Recommendation to see how to improve Reader Engagement by segment.
💡Best practice: Focus on metrics that are below the industry average - and don’t forget to celebrate the ones where you are above!
How do I get more subscribers?
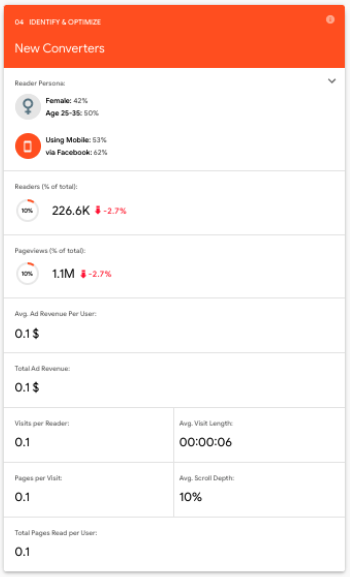
In Reader Revenue, New Converters compares your subscribers and donors to your Casual Readers, Loyal Readers, and Brand Lovers, so you can focus on the audiences most likely to subscribe or donate.
Who are my subscribers and donors?
You’ll need to first set up a Goal in Google Analytics.
STEP ONE
Create a goal in Google Analytics. Follow these instructions if you’re in Universal, and these instructions if you’re in Google Analytics 4.
STEP TWO
Go to Settings in News Consumer Insights, and select your Goal.
STEP THREE
Go to Reader Revenue to see:
- Your subscribers’ or donors’ demographics
- Their engagement
- What device they use
- How they’re getting to your site
-
-
![gni_business_lesson_play_8]()
Build your audience with Realtime Content Insights
LessonSee how your articles are performing, in real time