데이터 시각화: Tilegrams 소개.
데이터를 매핑하는 새로운 방법.
무료 데이터 시각화 도구.
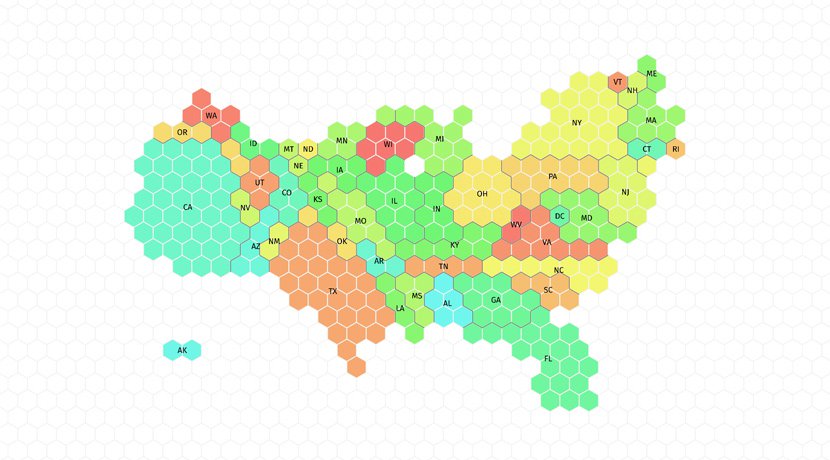
“타일이 깔린 통계 지도”의 약어인 Tilegrams는 데이터 집합을 비례량에 따라 타일로 표현한 지도입니다. Tilegrams는 기존의 지리학적 지도보다 더 정밀하게 인구학적 데이터를 나타내면서도 이해하기 쉬운 형태를 유지하고 있습니다. 예를 들어, 미국의 Tilegrams는 각 지역의 거주자 수를 표현하며 총 인구를 나타냄과 동시에 미국 영토의 형태도 쉽게 알아볼 수 있습니다. Tilegrams는 단순히 인구 관련 데이터를 표시하는 것에 그치지 않고 지리학적 지역 간 데이터를 시각화하여 비례 비교하는데 사용될 수 있습니다. 여기에서 도구를 확인하세요:
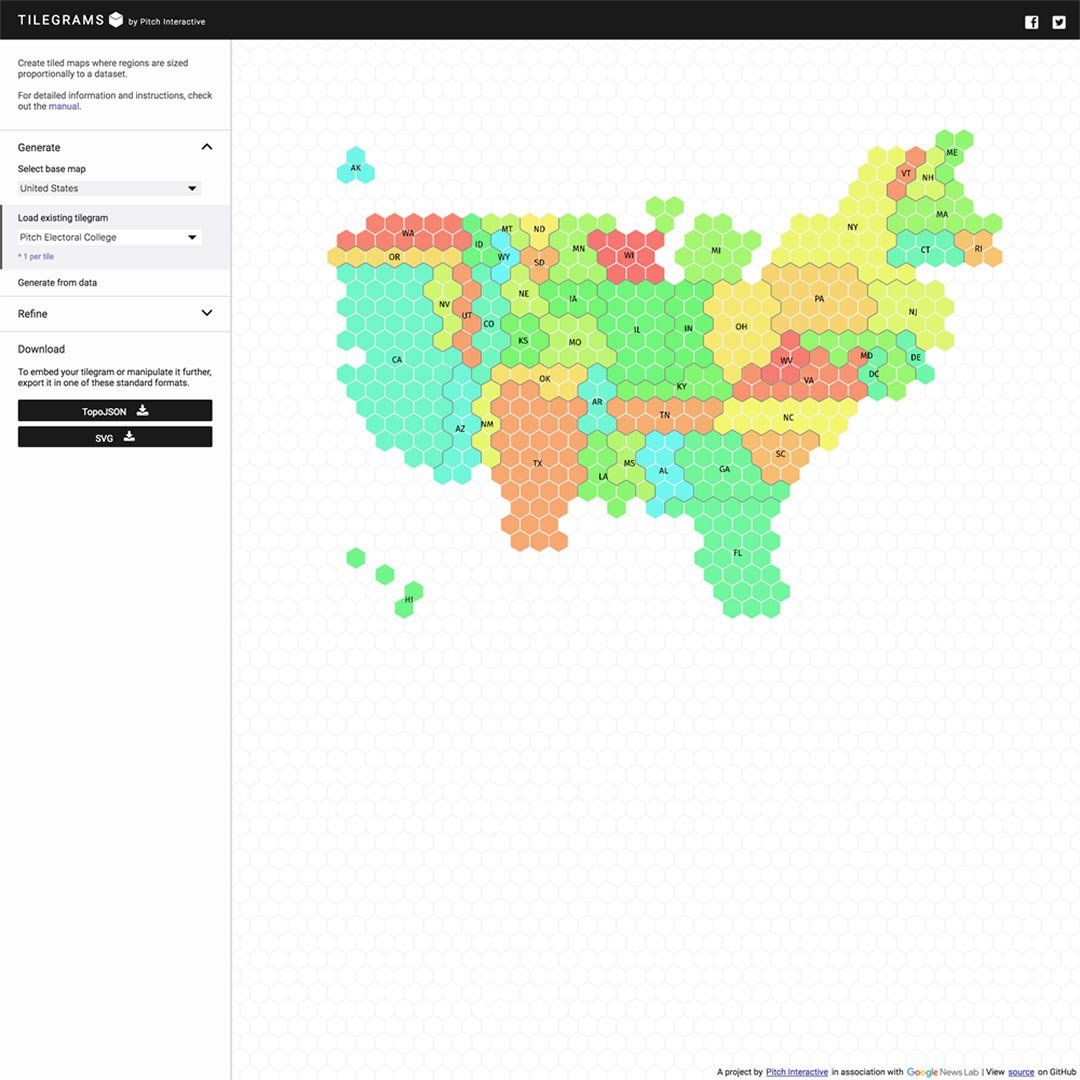
기존 Tilegrams에 액세스하기.
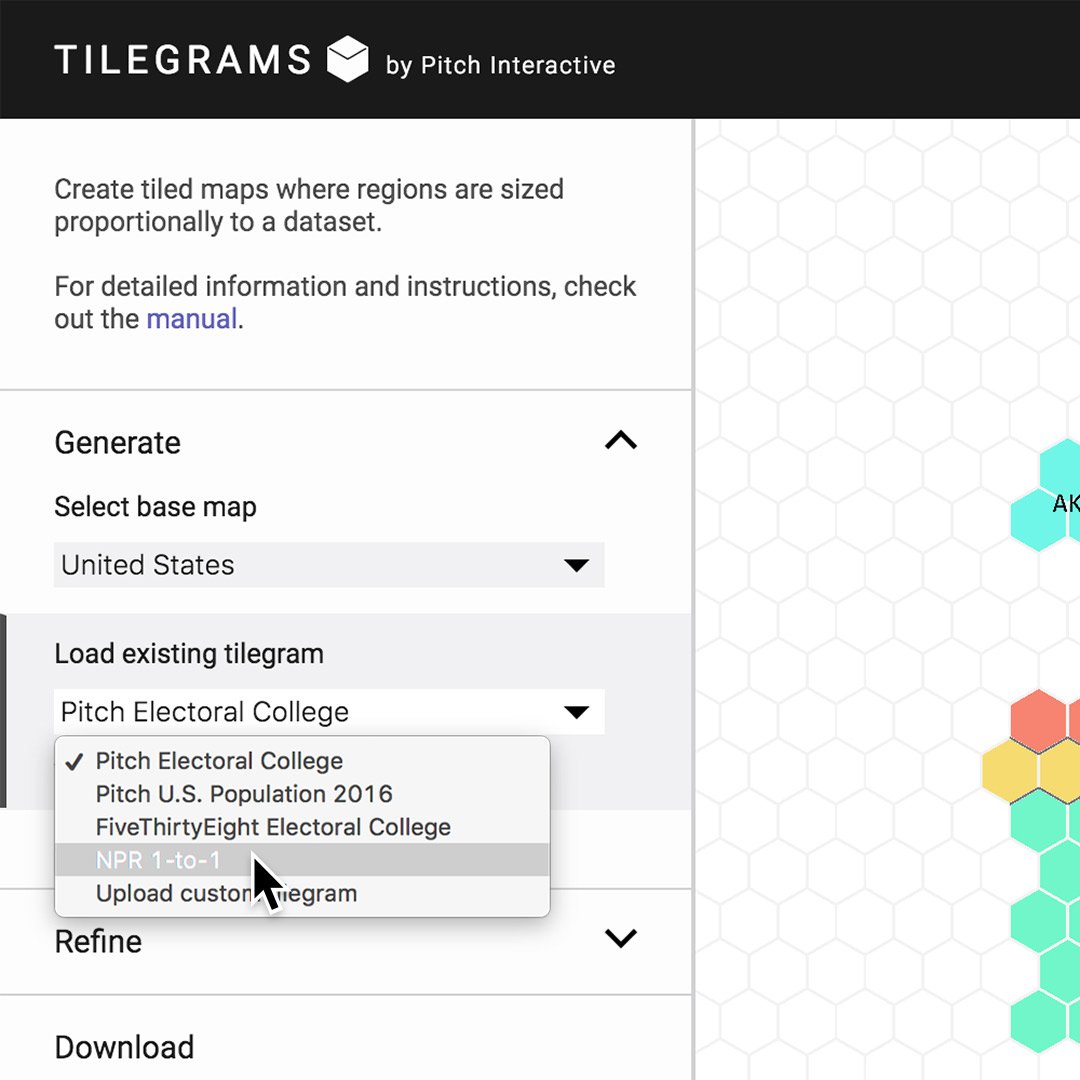
Pitch Interactive가 개발한 Tilegrams는 모든 사용자에게 개방되어 있습니다.
미국 지도를 포함하는 기존 Tilegrams 목록을 Pitch, NPR, FiveThirtyEight에서 찾아보실 수 있습니다.
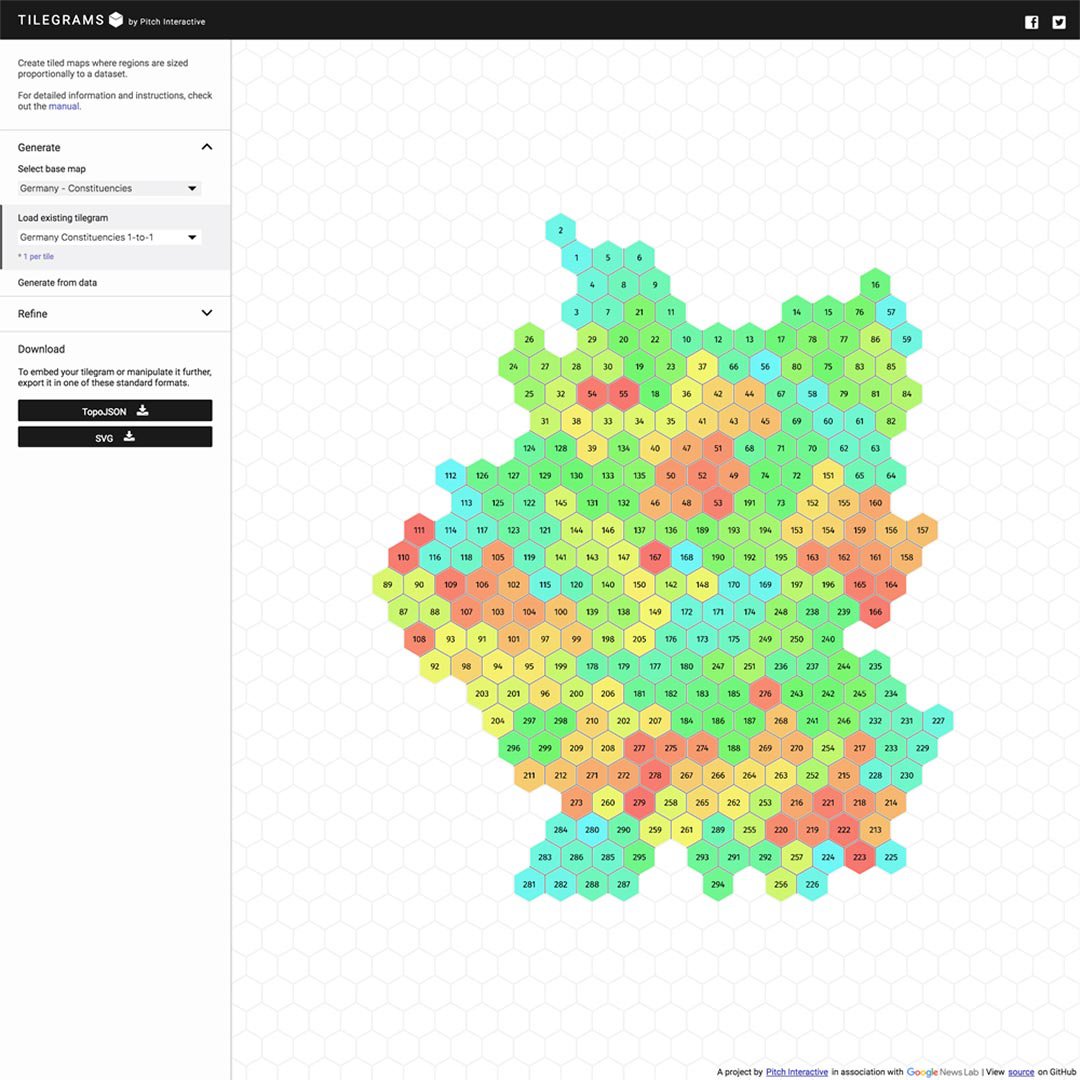
독일과 프랑스의 지도 또한 보유하고 있으며 국가 목록을 확장해 나가고 있습니다.
기존 Tilegrams 다듬기.

Tilegrams는 시각 자료를 컴파일하는 알고리즘을 사용하고 있으므로 부정확한 시각 자료를 표시할 수도 있습니다. 완전하고 정확한 기사를 전달하기 위해 다양한 방법으로 Tilegrams를 수정할 수 있습니다. Tilegrams를 로딩하셨다면 여러 가지 방법으로 수정할 수 있습니다.
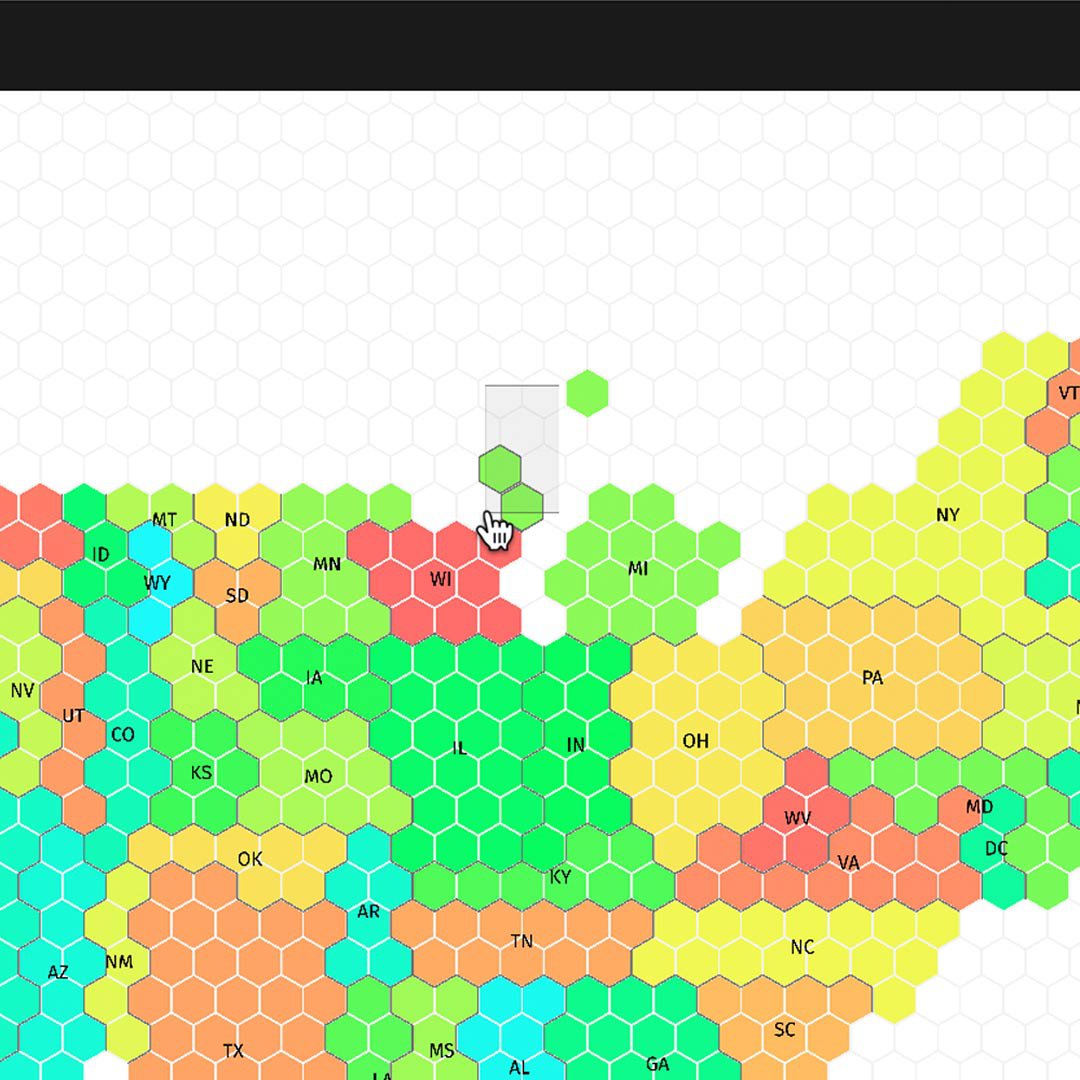
타일을 움직이려면 클릭하고 드래그하세요.
여러 타일을 움직이려면 클릭 및 드래그를 사용해 사각형으로 영역을 선택한 뒤 이동하세요.
특정 지역을 움직이려면 그 지역 내의 타일을 더블 클릭하여 지역 전체를 선택한 뒤 드래그하세요.
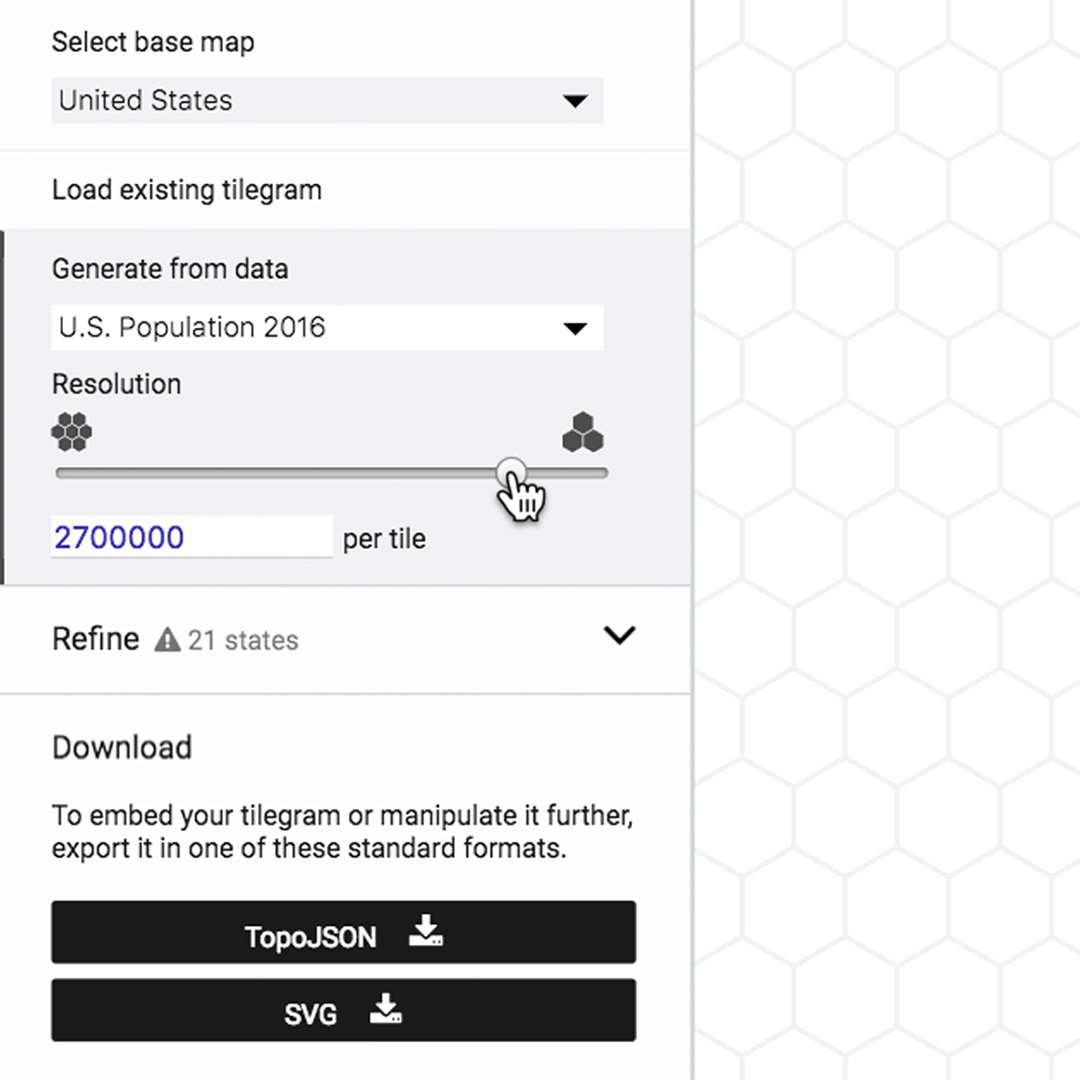
해상도를 조절하려면 데이터에서 생성하기를 클릭하고 슬라이더를 사용하세요.
통계 정확도 확인하기.
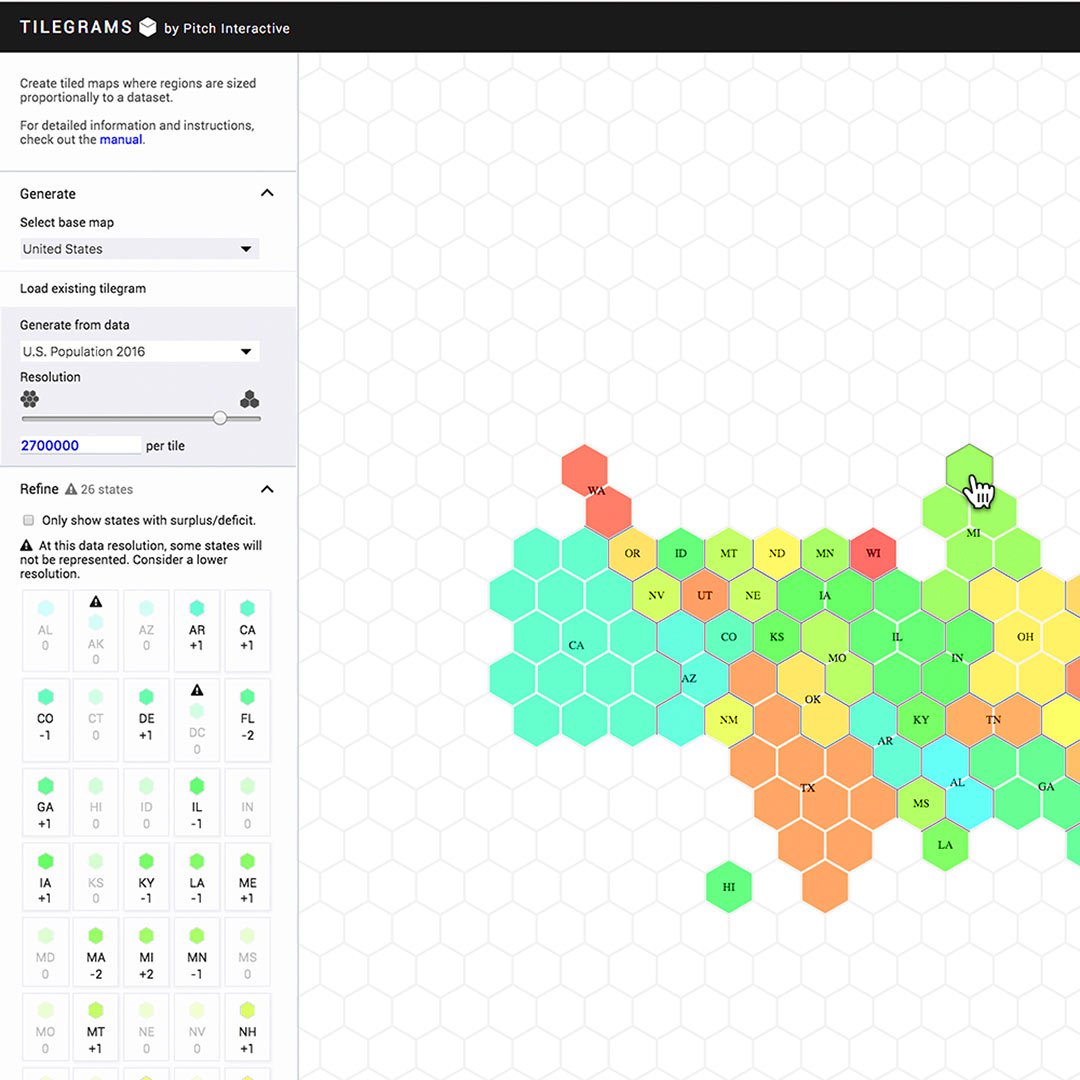
데이터를 다듬는 과정에서 지도가 바뀌고 오류가 발생할 수 있습니다. 정확도를 유지하면서 동시에 한눈에 들어오는 결과물을 만드는 것이 쉽지 않으므로 Tilegrams에서 일반적으로 발생하는 일입니다 나만의 Tilegrams를 만들기 시작하면 이러한 상충 관계를 겪을 수 있습니다.
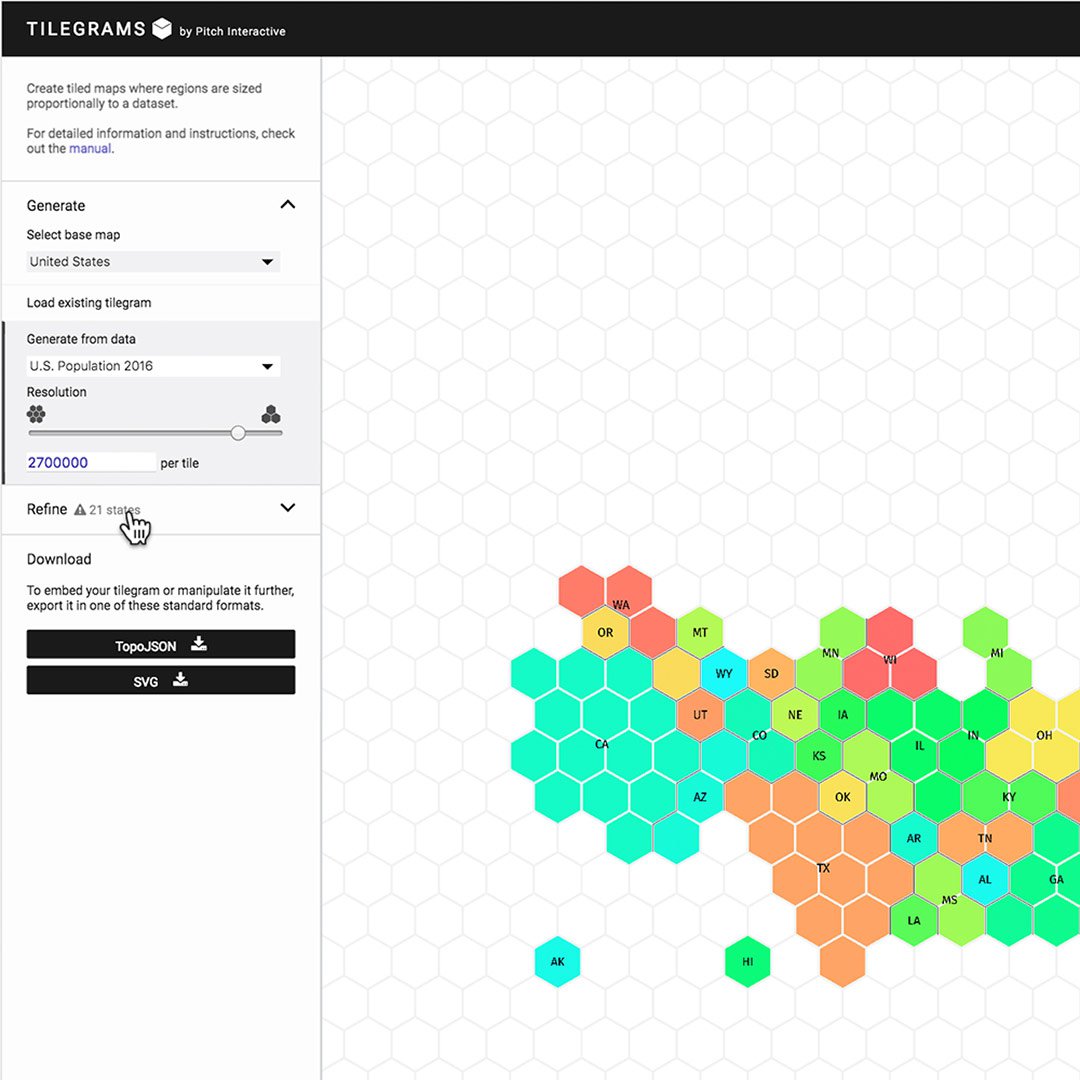
다듬기를 클릭하세요.
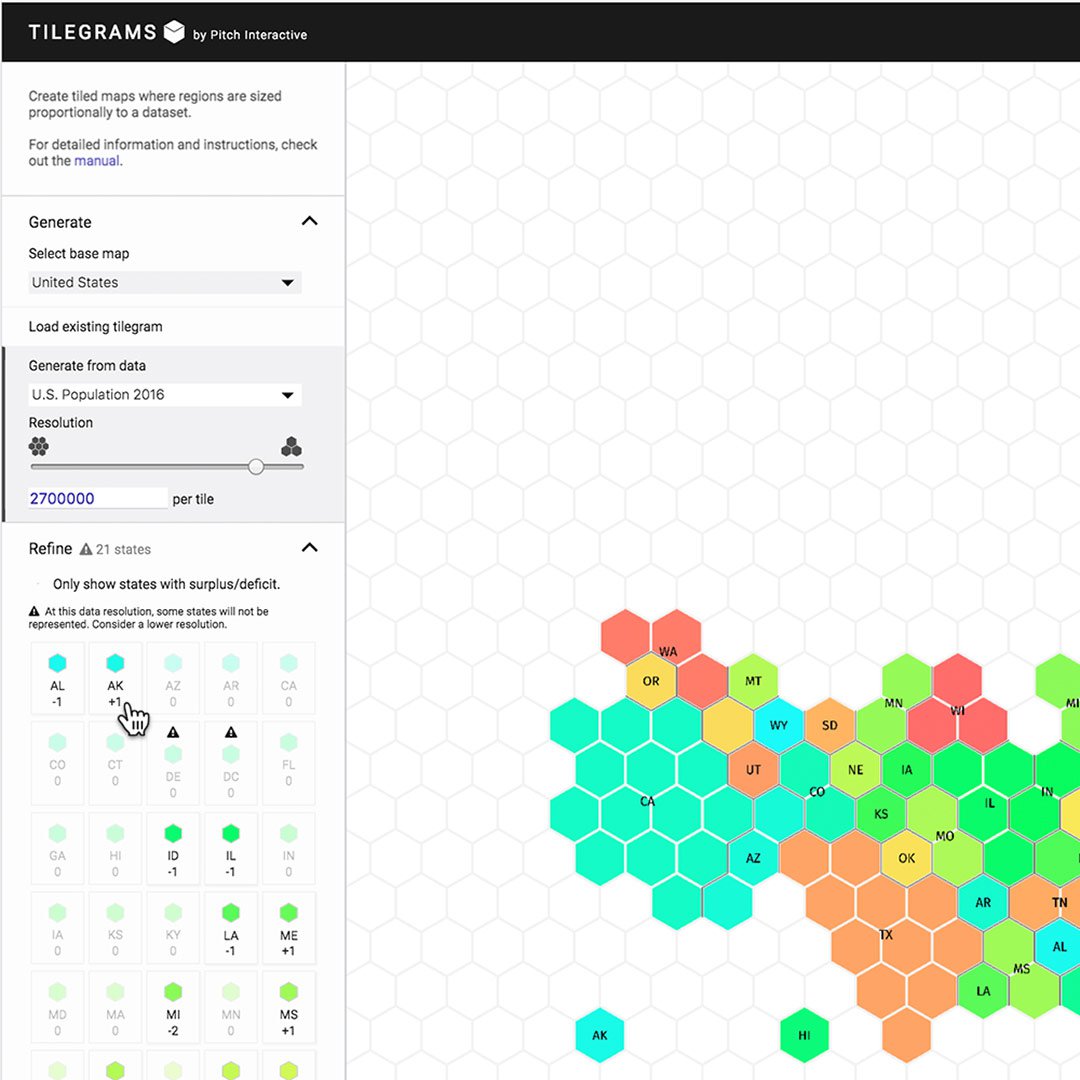
“주 타일”에서는 숫자와 육각형을 포함한 각 주의 목록이 표시됩니다. 숫자는 현재 지도의 해당 지역이 보유한 타일 수의 차이 및 데이터 집합을 기반으로 해당 지역이 보유해야 하는 타일의 수를 나타냅니다. 그 숫자가 양수이면 해당 지역은 지도상 너무 많은 타일을 보유한 것입니다 음수인 경우, 타일이 충분하지 않은 것입니다. 경고 표시가 나오는 경우, 해당 지역에 설정된 해상도에 맞는 데이터가 충분하지 않아 단 한 장의 타일도 표시할 수 없는 경우입니다.
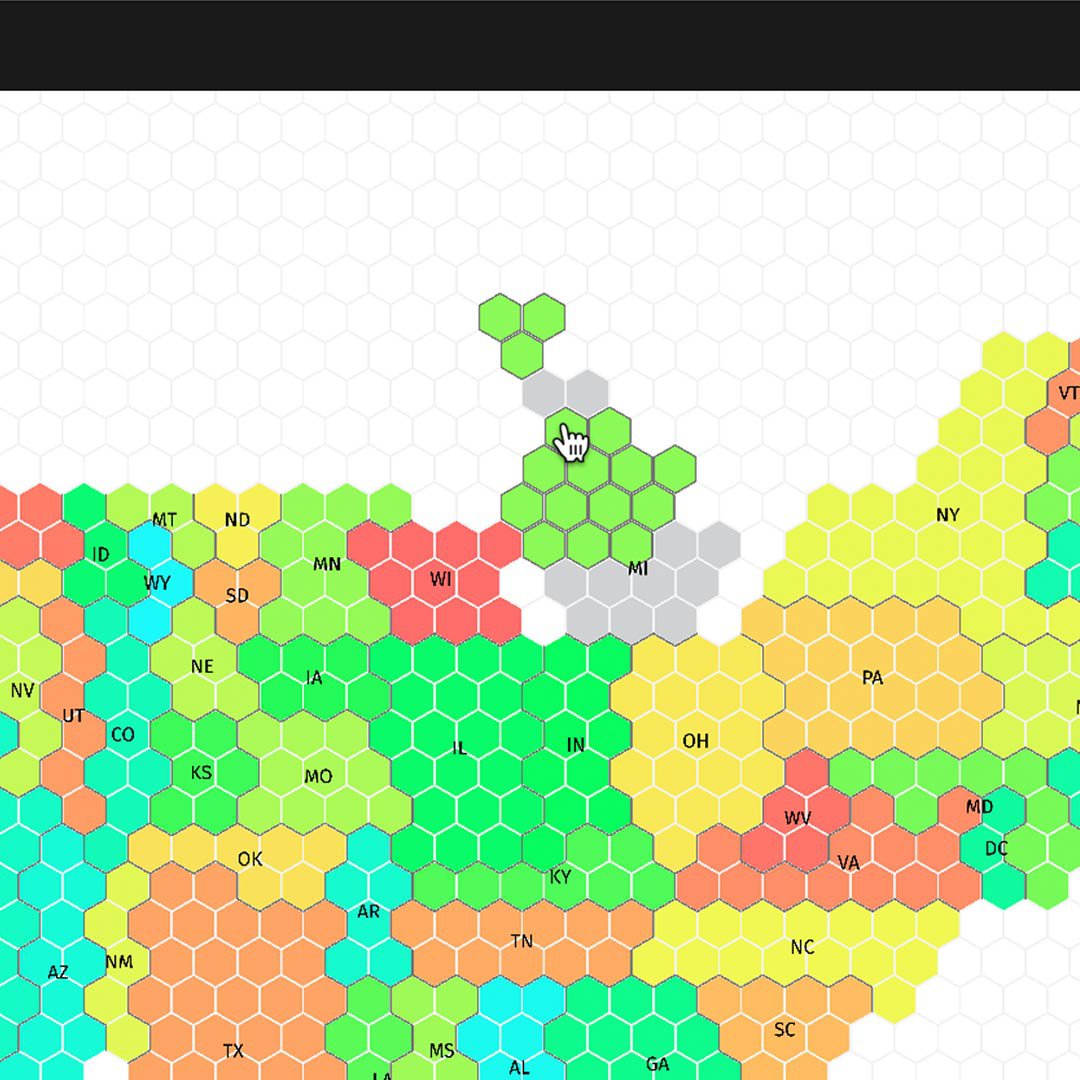
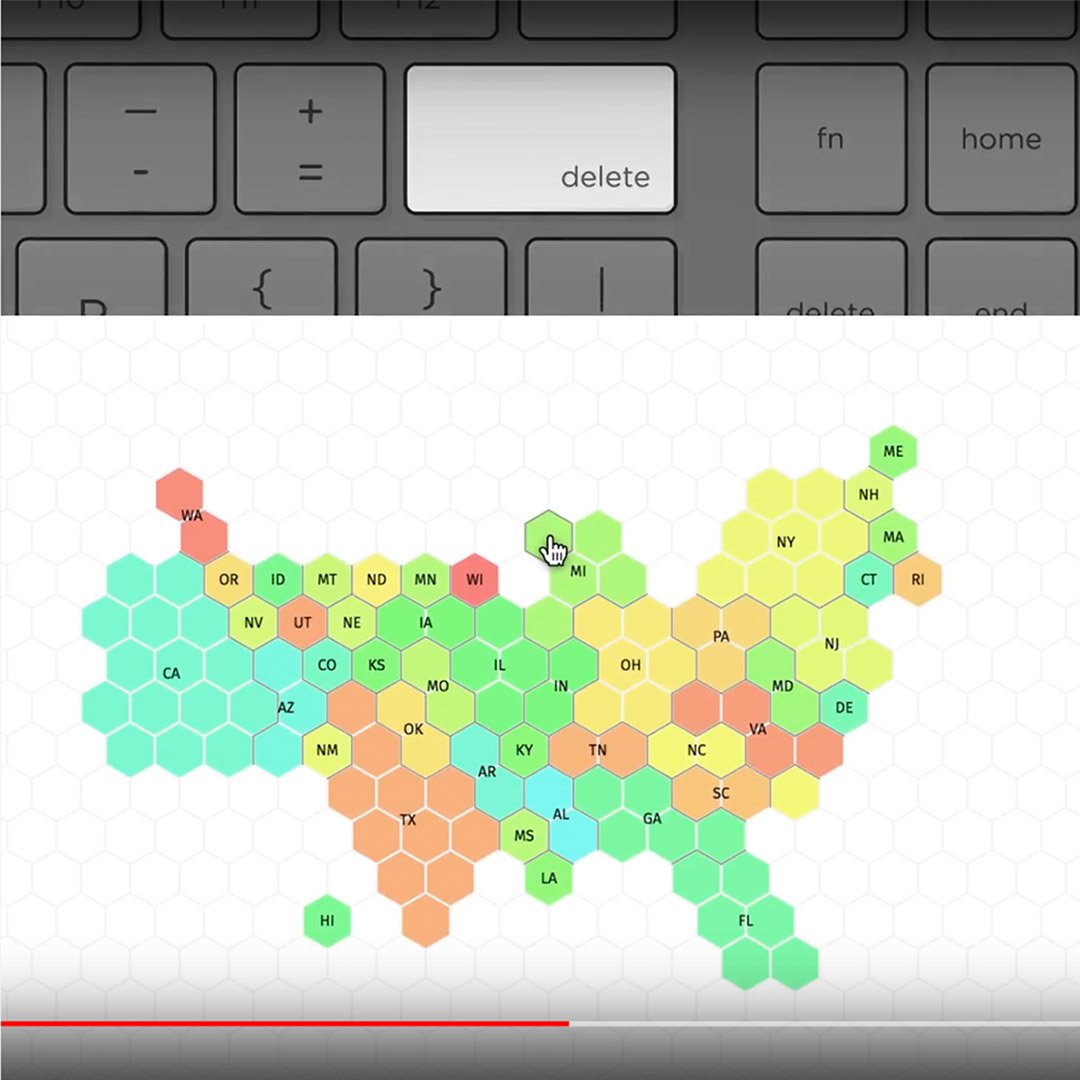
지도에서 타일을 제거하시려면 타일을 클릭한 뒤 키보드의 Delete키를 누르세요.
타일을 추가하시려면 다듬기를 선택한 뒤 왼쪽의 사이드바에서 육각형을 클릭하고 지도 위로 드래그하세요.
기존 Tilegrams 내보내기.
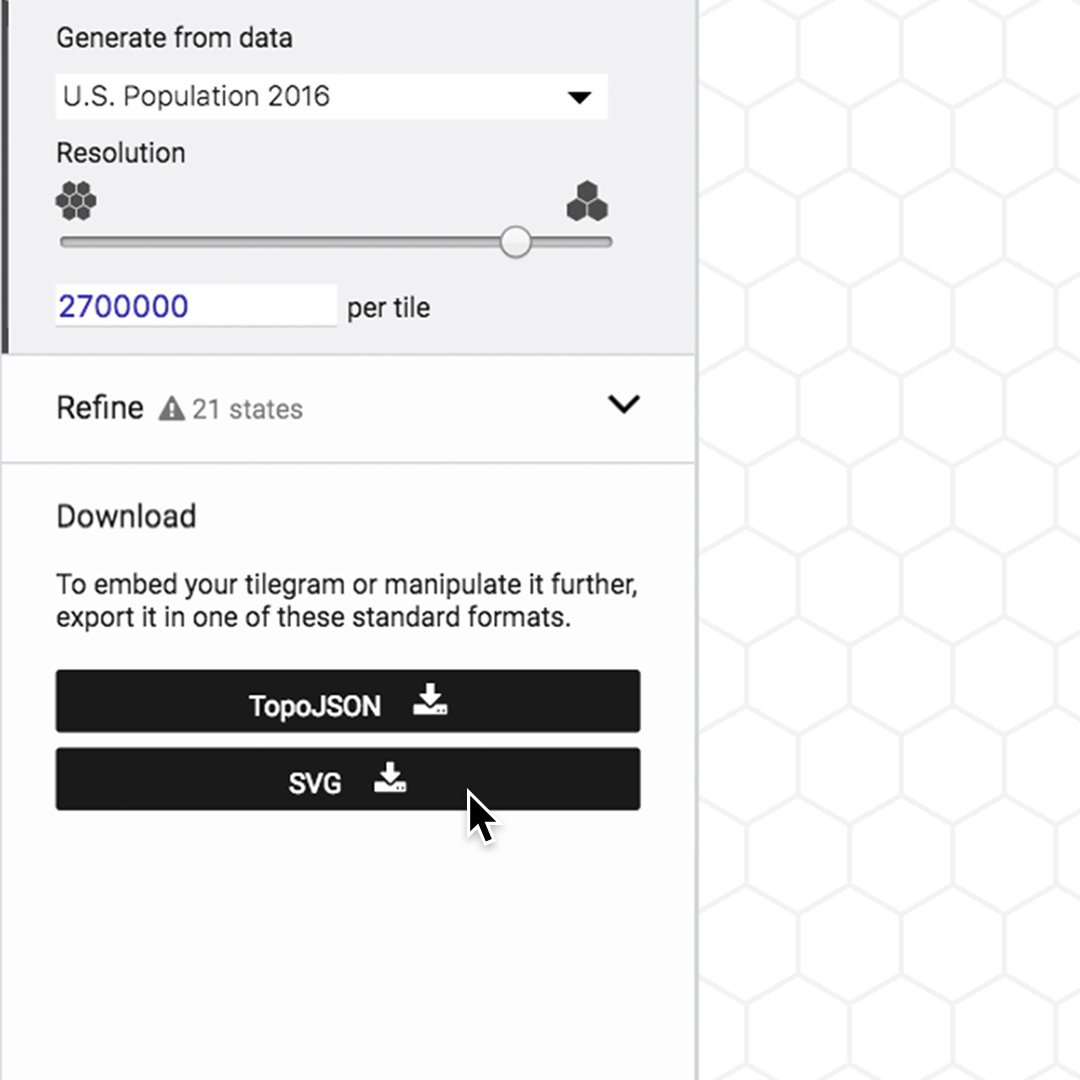
Tilegrams 결과에 만족하는 경우 해당 파일을 내보내실 수 있습니다. 디자인 소프트웨어에서 사용하려면 하단 왼쪽의 버튼을 이용해 SVG 파일 형식을 고르세요. 개발자인 경우, 웹 응용 프로그램으로 내보내려면 TopoJSON을 선택합니다.
Tilegrams의 기본을 더 알아보려면 도구를 살펴보고 Medium의 게시글을 읽어보세요.