Wizualizowanie wyborów
Ożyw wybory za pomocą interaktywnych wizualizacji

Przegląd lekcji
Dzięki wizualizacjom Twoi odbiorcy szybciej przeanalizują sondaże
Jak w interesujący sposób przedstawić wyniki wyborów i sondaże, tworząc interaktywne wizualizacje.
- Tworzenie kart profilu kandydata
- Szybkie wizualizacje z Data Gif Maker
- Customizing your visualization in Flourish

Budowanie profili kandydatów w Flourish
W tej sekcji użyjemy narzędzia Flourish do wyświetlenia kluczowych informacji o kandydatach politycznych. Zapoznamy się z szablonami kart Flourish i zastanowimy się nad najlepszym sposobem przedstawiania różnych rodzajów danych.
Przejdź do swojej biblioteki Flourish i kliknij „nowa wizualizacja”, aby przejrzeć menu szablonów. Przewiń w dół, aby wyświetlić szablony kart. Wybierz „profile”, choć możesz eksperymentować z dowolną domyślną wizualizacją.
Przełącz z widoku „podglądu” na „dane” nad wizualizacją. Zamiast na zbiorze danych, skup się na prawej stronie ekranu z napisem „wybierz kolumny do wizualizacji”.Wizualizacja ta pozwala wybrać tytuł, obraz, kategorię karty, podtytuł i dodatkowy tekst.
Aby zrozumieć, jak działa selektor kolumn i jak wyświetlane są dane, przyjrzyj się, które kolumny są wybierane i porównaj z tym, co widzisz w wizualizacji.
Usuń wszystkich kandydatów z wyjątkiem Joe Bidena i Kamali Harris, a następnie dodaj Donalda Trumpa i Mike'a Pence'a.Mniej więcej tak powinna teraz wyglądać Twoja wizualizacja.
Kolumna C, która odpowiada kategorii karty zgodnie z panelem danych, ma obecnie ustawioną kategorię płci. Zmieńmy ją na partię polityczną kandydata. Biden i Harris to Demokraci, a Trump i Pence to Republikanie.Następnie możemy przełączyć na podgląd i zmienić kolory kategorii na czerwony dla Republikanów i niebieski dla Demokratów.
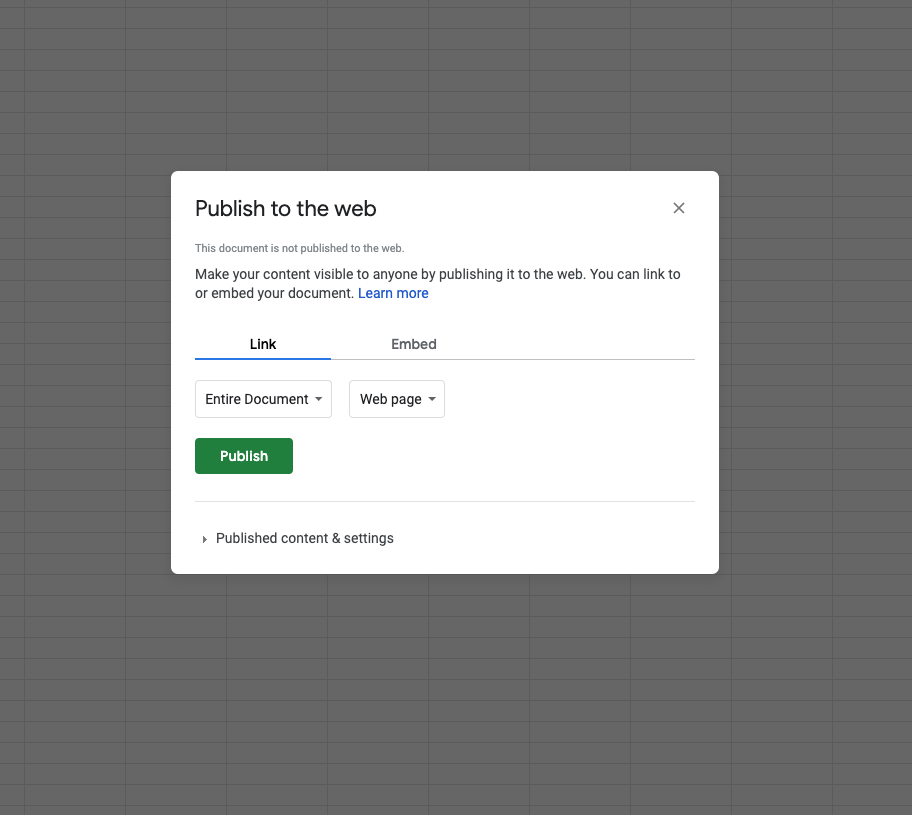
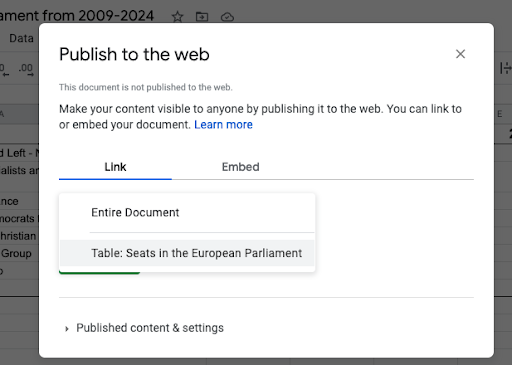
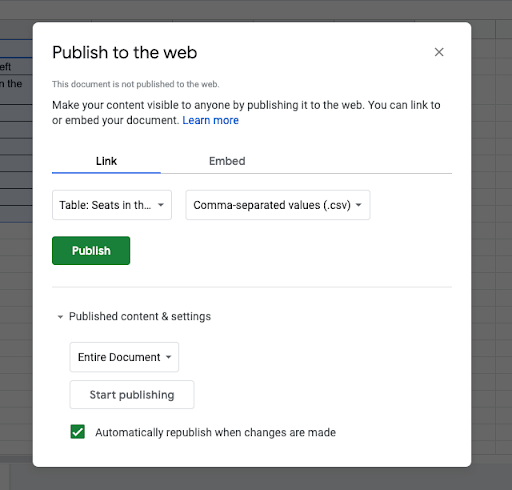
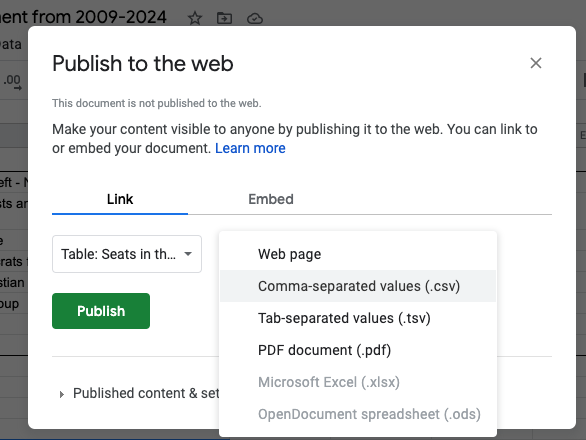
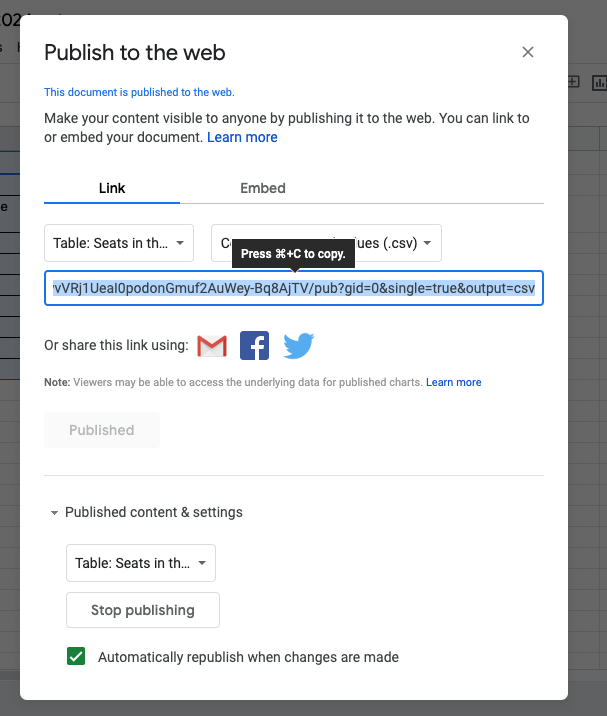
Skopiuj link, aby go używać w rozmachem później.


Implementing your URL in Flourish
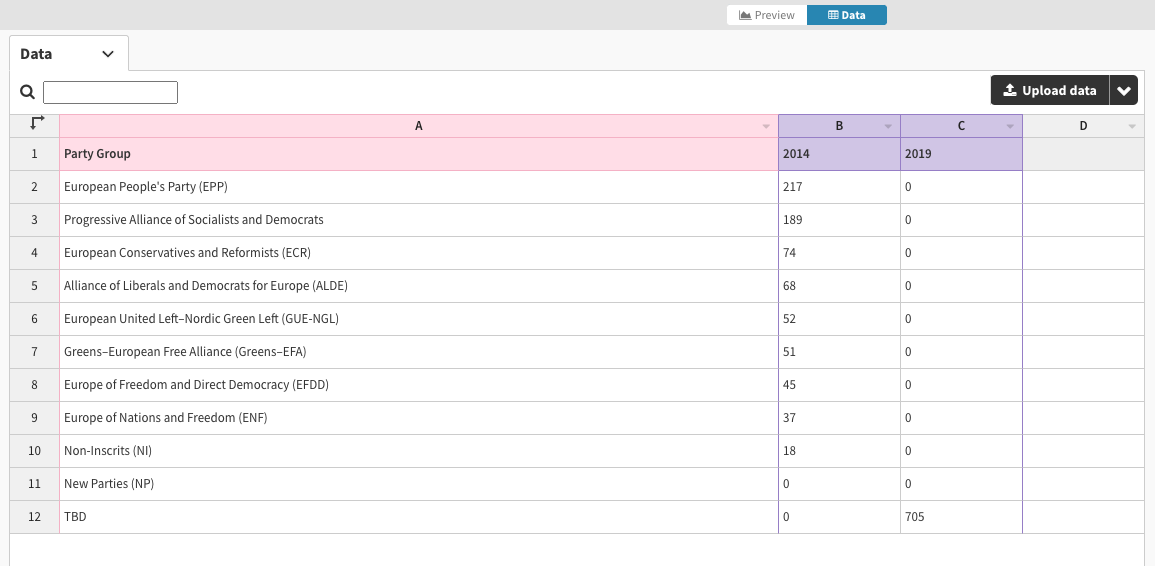
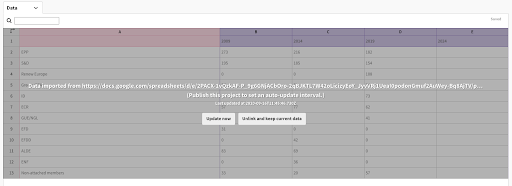
Link your data sheet to your visualization to update the values automatically
Go to Flourish: Choose a visualization that you would like to create using the Live CSV feature. Open the visualization and click “Data”. You will see a drop down menu on the right.
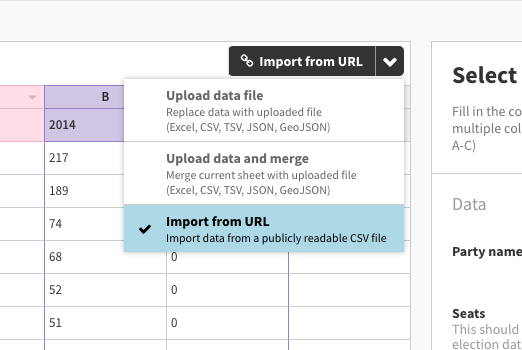
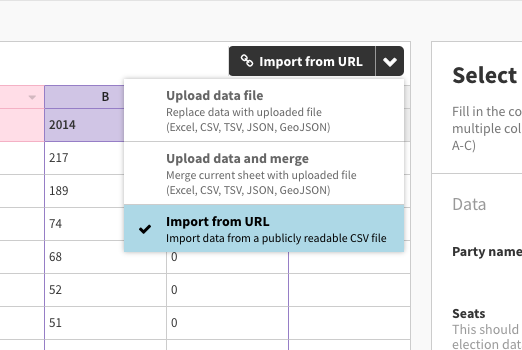
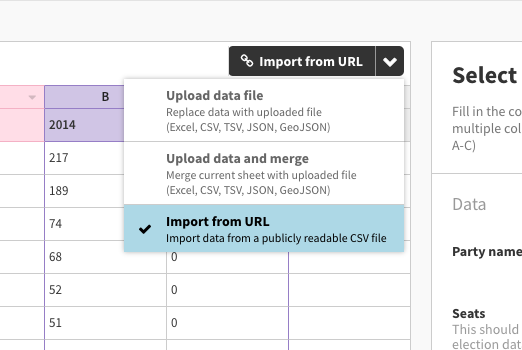
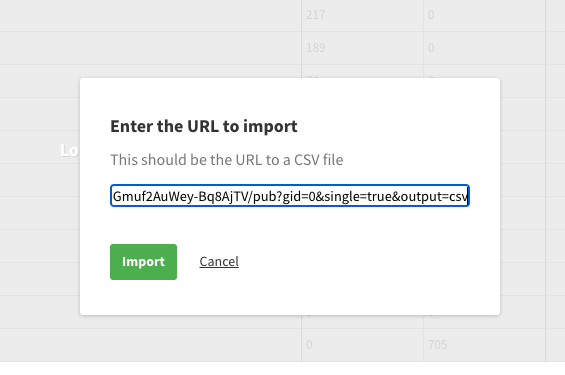
Click on the drop down tab and choose between “Upload data file”“Upload and merge”and “Import from URL”.To use the Live CSV function, select “Import from URL”.
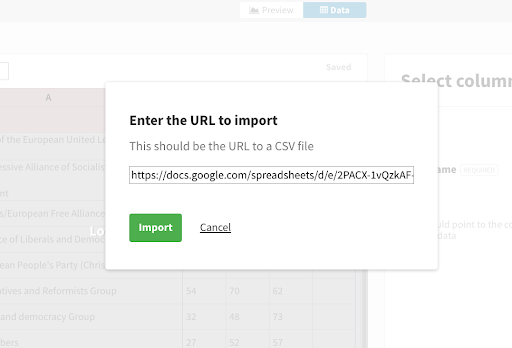
Paste the Google Sheet URL and click "Import".
Your sheet should be linked to your Flourish visualization now.The data sheet will look greyed out. There will not be an option to edit the values in Flourish.


Customizing your visualization in Flourish
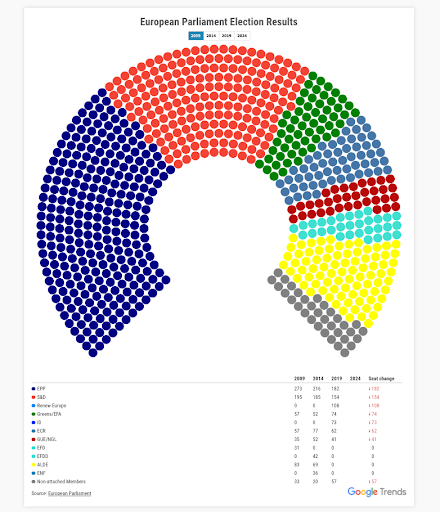
The final step is to customise the appearance of the visualisation
To make changes to the visualization, first you have to unlink your Google Sheet from Flourish temporarily.Go to your data sheet in FlourishClick “Unlink and keep current data”The grey overlay should disappear afterwards. You can start editing your visualization now.
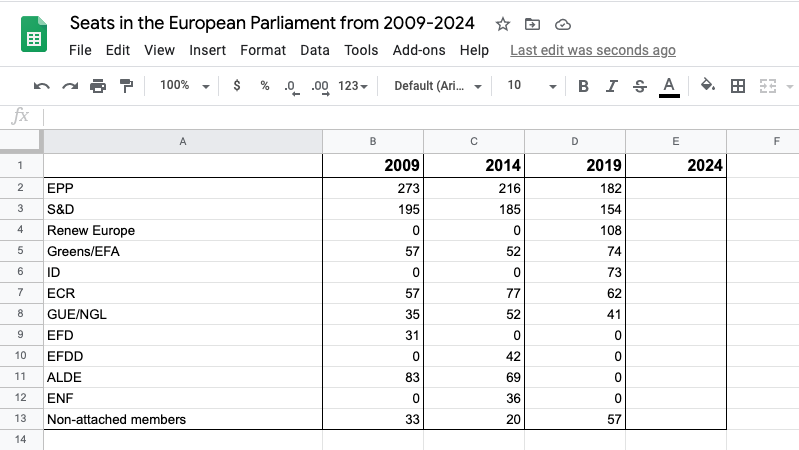
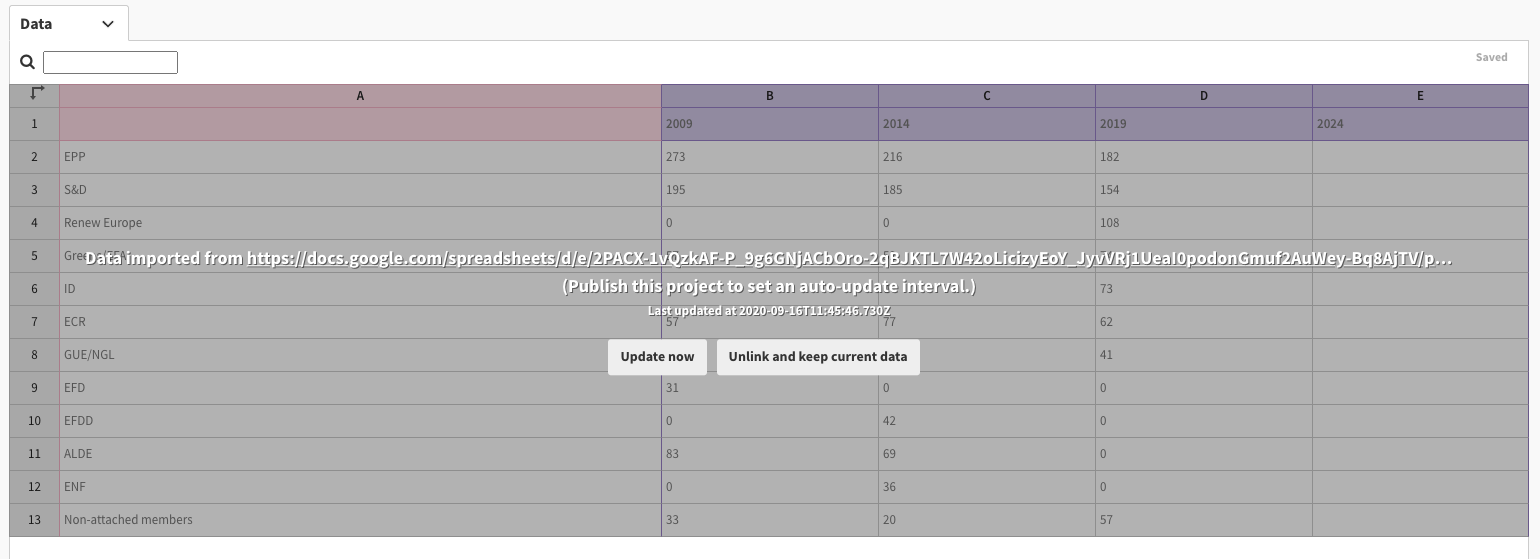
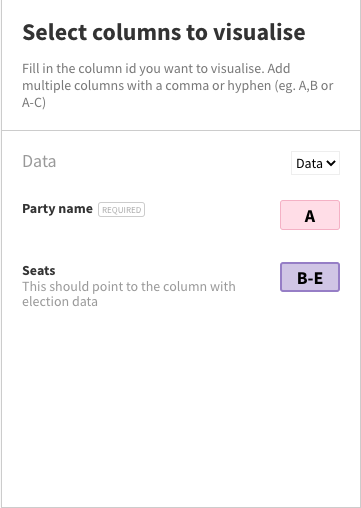
First, switch from “data” to “preview”To make sure the correct values are being displayed in the visualization, go to “Select columns to visualise” and pick the columns you would like to be used in the parliament chart.In this case, you need columns B to E to visualize the seats correctly.
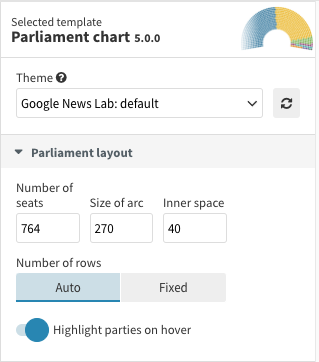
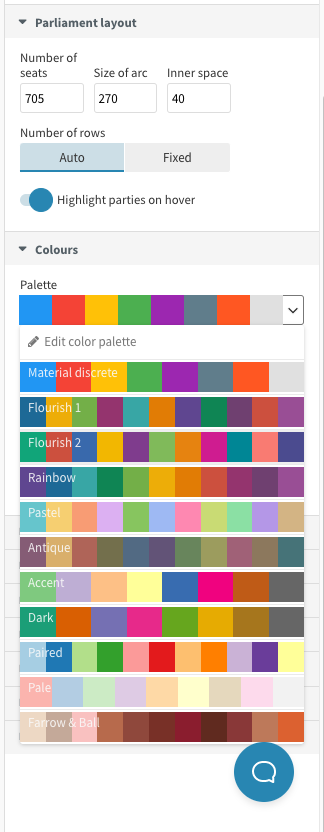
The number of seats in the parliament chart can be adjusted in Flourish. In 2009, 764 members were elected The European Parliament. Go to “Parliament Layout”Change the number of seats.
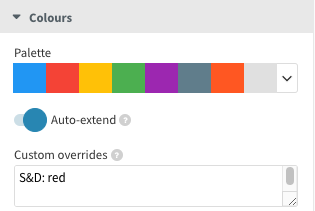
To adjust the colours in the visualization: Switch from “data” to “preview”Open the tab “Colours”Choose a preset design or customize displayed colours
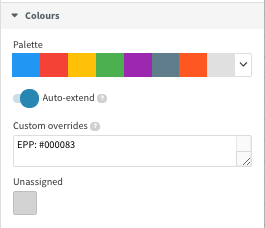
A custom colour palette is available too: Click into the field “Custom overrides”Put in a value, separate it with “:” and follow up with a colourExample: S&D: red
To use special colour hues, use Hex Colour Codes.
Reconnect the Google Sheet to Flourish after finishing the customisation. Go back from “preview” to “data” Click the drop down menu on the right and repeat the import process with your Google Sheet.The visualization will be automatically synchronized with the Google Sheet again.
This is the finished visualization! To update the seats in the European Parliament after the 2024 election, add the numbers in your Google sheet and Flourish will update your visualization. Click here for finished example


-
Archiwum Google News: Otrzymaj dostęp do informacji sprzed lat.
LekcjaOdkryj historyczne publikacje cyfrowe i zeskanowane gazety. -
-
How to make a good Web Story
LekcjaCreating a strong, compelling Web Story is as easy as creating an article or a video, and the interactive nature of Web Stories plays to the rapidly shifting desires and demands of online audiences.


