![GO801_GNI_AccessWorldData_TitleCard_yOTrxyr.jpg](https://storage.googleapis.com/media-newsinitiative/images/GO801_GNI_AccessWorldData_TitleCard_yOTrxyr.original.jpg)
ハイクオリティデータを見つけてビジュアル化
![GO801_GNI_AccessWorldData_Card1_Image1.jpg](https://storage.googleapis.com/media-newsinitiative/images/GO801_GNI_AccessWorldData_Card1_Image1.original.jpg)
タイトな締め切りに向けて、ストーリーに使用するハイクオリティなデータを探すのは難しいでしょう。Google Public Data Explorerは、世界がどのように変化しているのか、データを見つけて解釈し、シェアするのに役立ちます。
そこには信頼あるソースから集約したデータがあり、洗練されたビジュアルを作成するのに簡単なツールがあります。Google Public Data Explorerでは、時間をかけた変化をモニターしたり、トレンドを判別したり、メトリクスを比較したり、データを使ってストーリーを改善することができます。
レッスンPDF >をダウンロードする
![GO801_GNI_AccessWorldData_Card1_Image1.jpg](https://storage.googleapis.com/media-newsinitiative/images/GO801_GNI_AccessWorldData_Card1_Image1.original.jpg)
高品質データの一つのソース
![GO801_GNI_AccessWorldData_Card2_Image1.jpg](https://storage.googleapis.com/media-newsinitiative/images/GO801_GNI_AccessWorldData_Card2_Image1.original.jpg)
![GO801_GNI_AccessWorldData_Card2_Image2.jpg](https://storage.googleapis.com/media-newsinitiative/images/GO801_GNI_AccessWorldData_Card2_Image2.original.jpg)
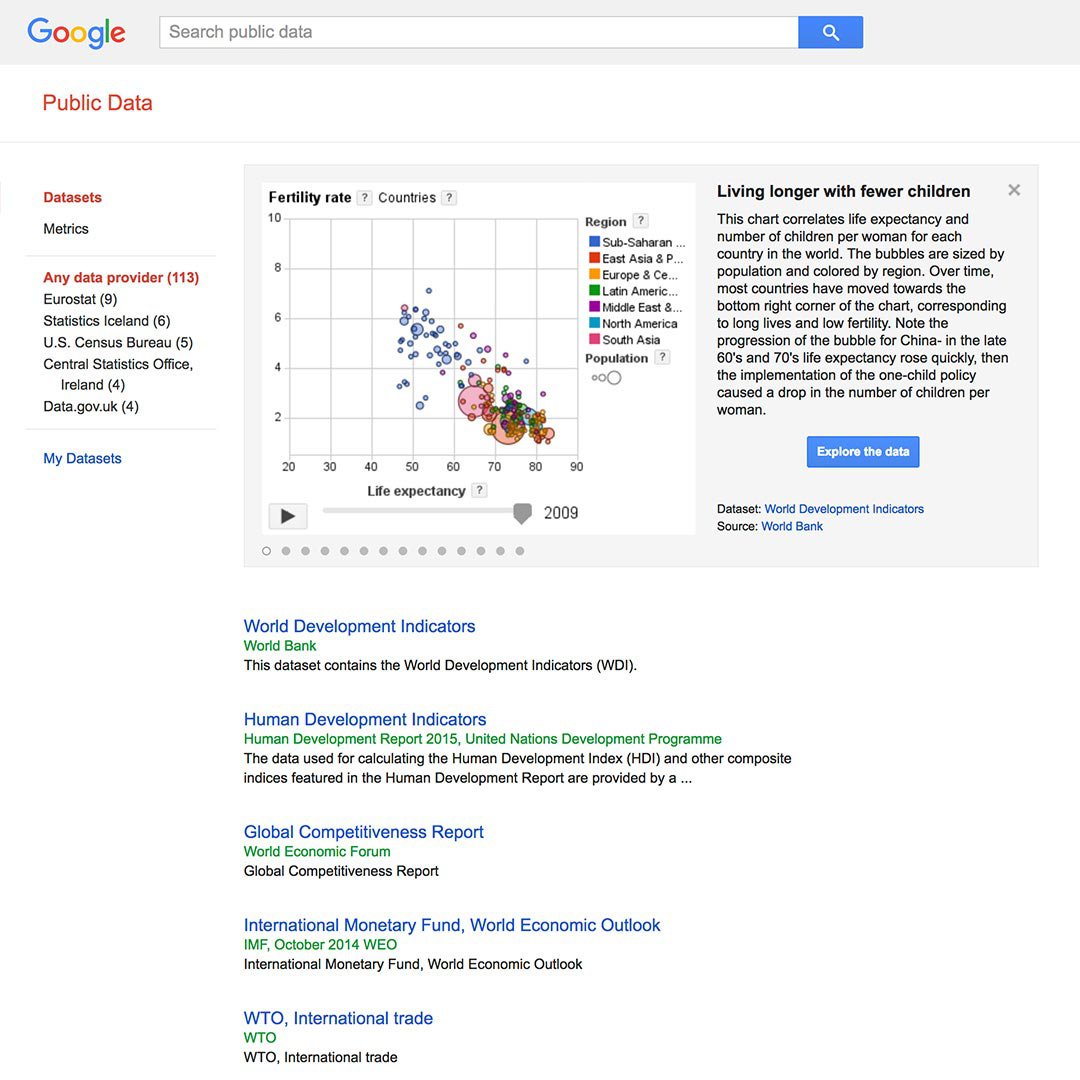
世界銀行、 IMF、 EurostatなどのPublic Data Explorerは、環境、経済、労働、健康、教育、貧困などに関する世界的な統計を供給しています。国または地方の政府機関、大学、NPOなどから詳しいデータを見つけることもできます。調べている内容が「世界のCO2排出量」のように大きなものでも、または「テキサスの高校中退者数」のようにニッチなものでも、あなたのストーリーを豊かにするデータがそろっています。
Public Data Explorerは、新しいデータソースを見つけるのにも役立ちます。
データがいつ公開されたのか、誰が作成したのか知るには、青いリンクをクリックします。
データセットが設けられているサイトを開き、異なるファイルフォーマットを探すには、詳しい情報をクリックします。
![GO801_GNI_AccessWorldData_Card2_Image1.jpg](https://storage.googleapis.com/media-newsinitiative/images/GO801_GNI_AccessWorldData_Card2_Image1.original.jpg)
![GO801_GNI_AccessWorldData_Card2_Image2.jpg](https://storage.googleapis.com/media-newsinitiative/images/GO801_GNI_AccessWorldData_Card2_Image2.original.jpg)
速く簡単な検索のためのライブラリ
![GO801_GNI_AccessWorldData_Card3_Image1.jpg](https://storage.googleapis.com/media-newsinitiative/images/GO801_GNI_AccessWorldData_Card3_Image1.original.jpg)
![GO801_GNI_AccessWorldData_Card3_Image2.jpg](https://storage.googleapis.com/media-newsinitiative/images/GO801_GNI_AccessWorldData_Card3_Image2.original.jpg)
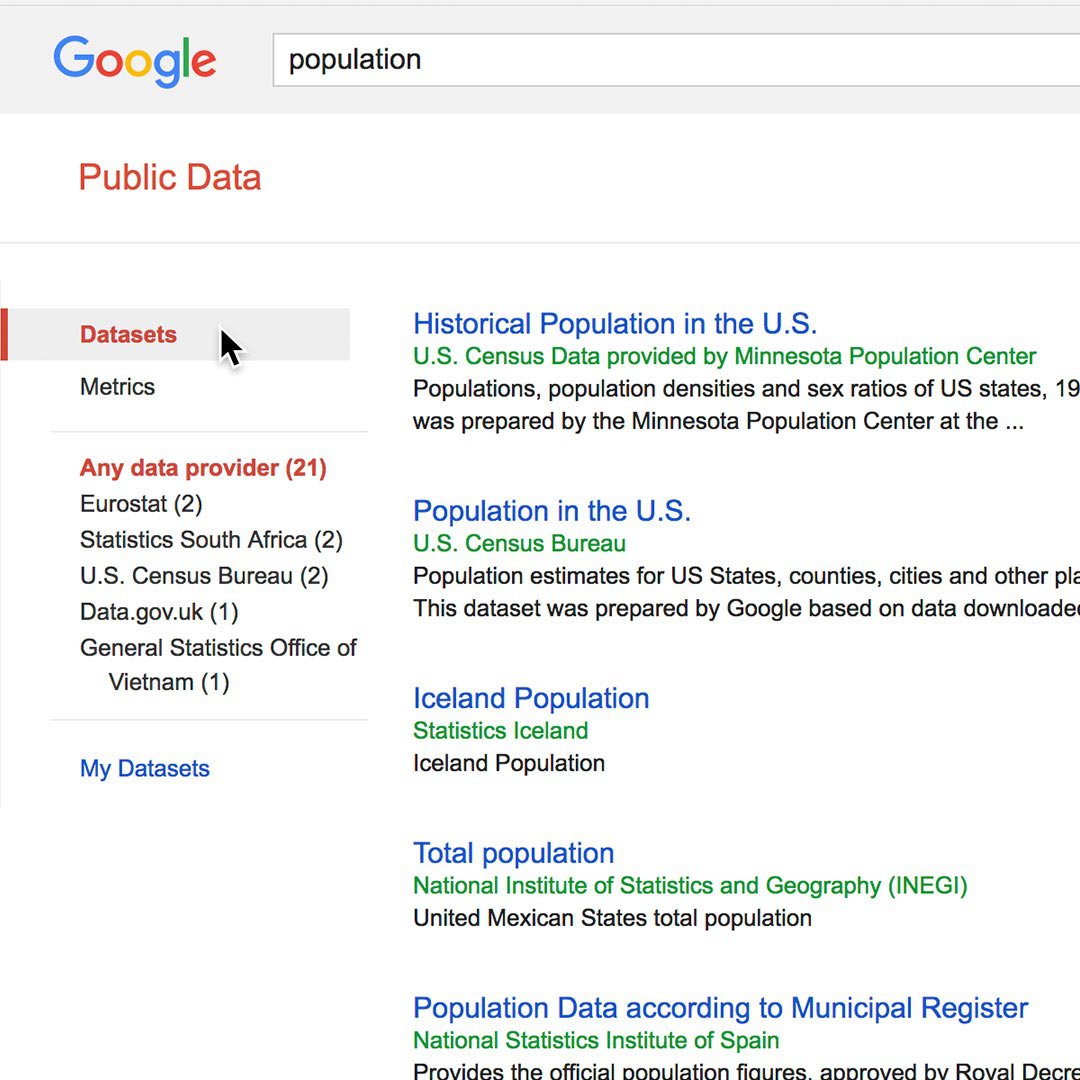
Google Public Data Explorerでは、データセットとキーワードごとのメトリクスの検索を、Google検索の使用と同じ速度で行うことができます。
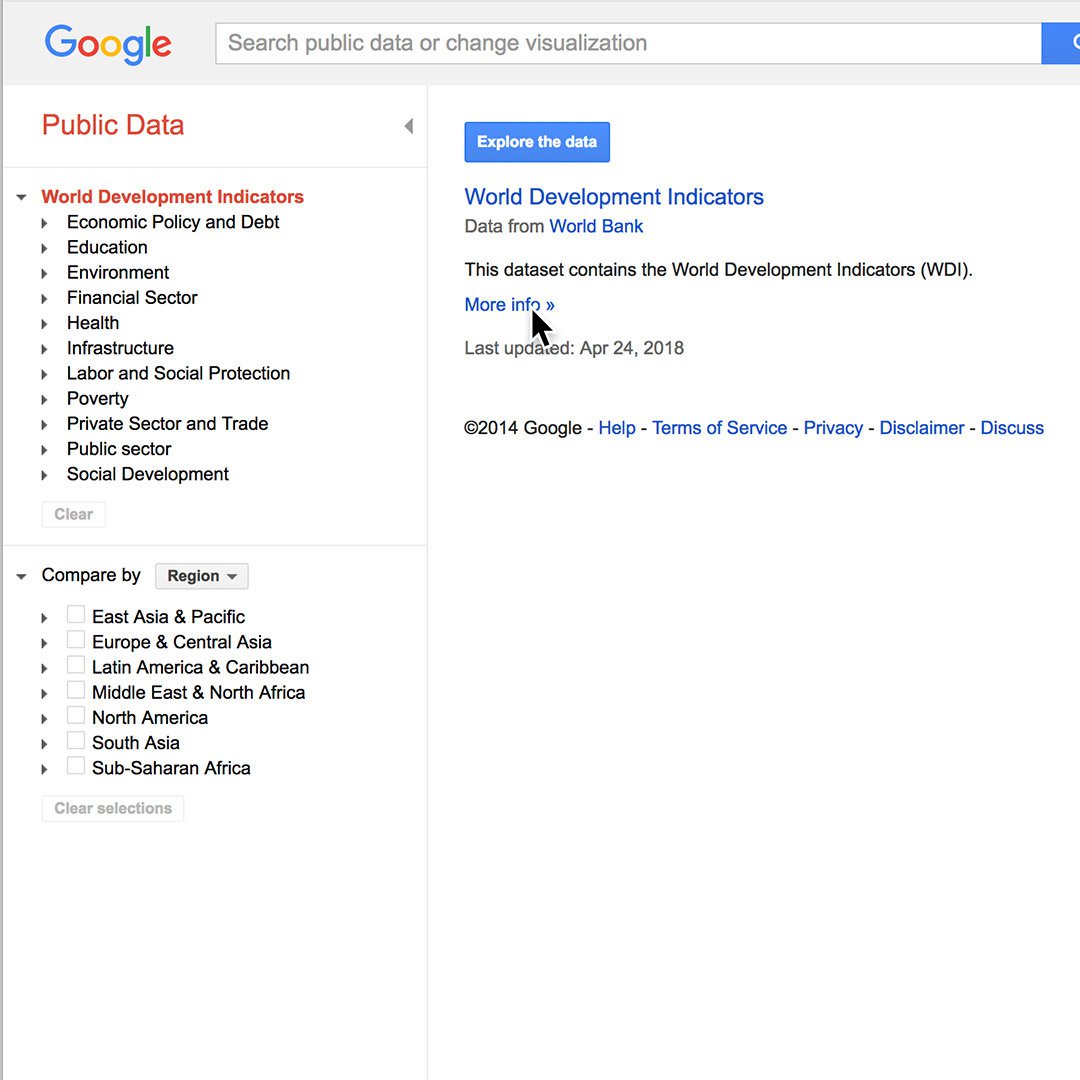
データセットは、一つのデータプロバイダによって作られた統計の束です。例えば「アメリカの人口」をアメリカから。国勢調査局と「世界発展指標」を世界銀行から。
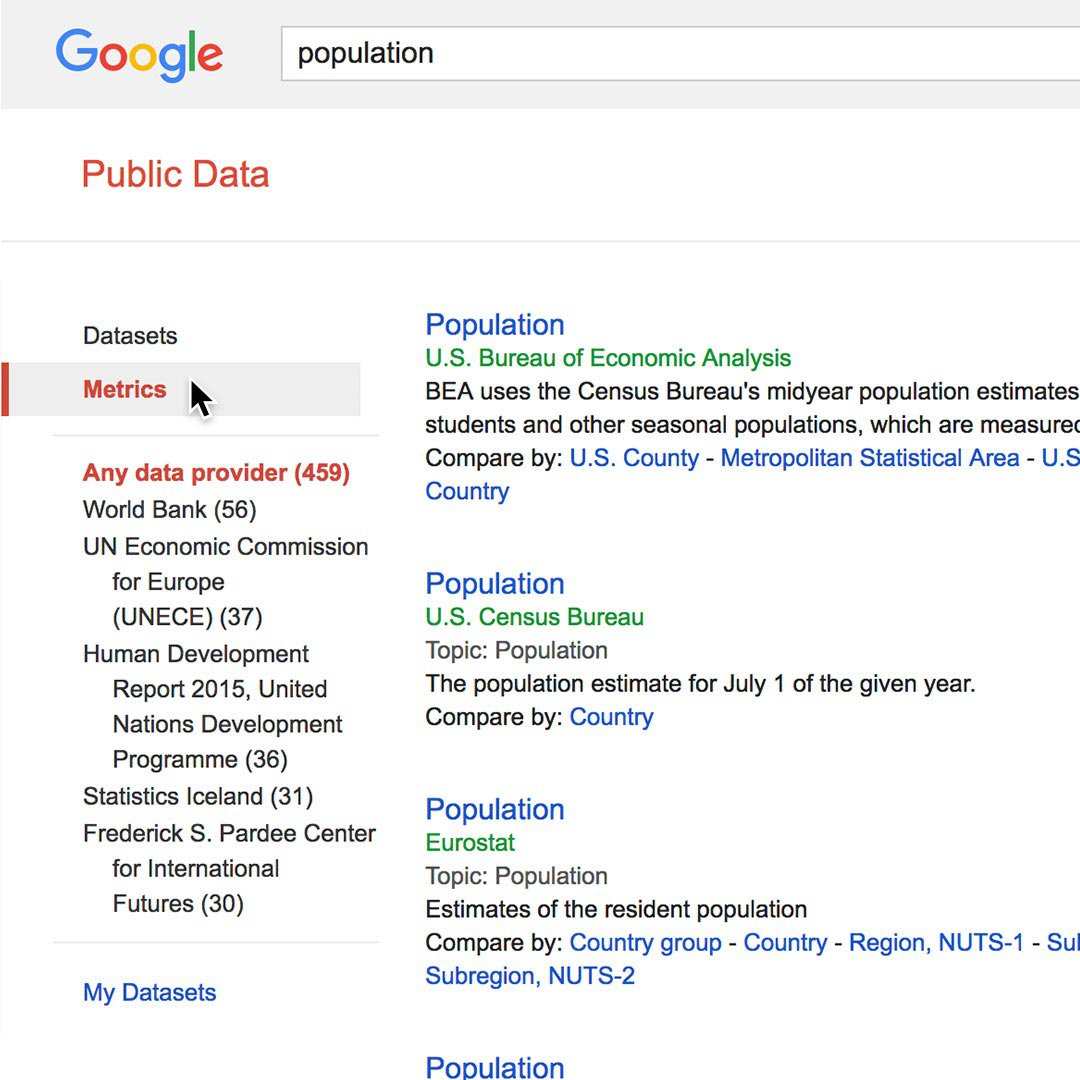
メトリクスは大きいデータセットを構成する統計です。「人口」や「失業率」、「GDP」といったトピックが含まれます。 デフォルトでは、検索結果はメトリクスモードで表示されます。ページの左サイドにあるデータセットをクリックすることでモードを切り替えることができます。
![GO801_GNI_AccessWorldData_Card3_Image1.jpg](https://storage.googleapis.com/media-newsinitiative/images/GO801_GNI_AccessWorldData_Card3_Image1.original.jpg)
![GO801_GNI_AccessWorldData_Card3_Image2.jpg](https://storage.googleapis.com/media-newsinitiative/images/GO801_GNI_AccessWorldData_Card3_Image2.original.jpg)
チャート、グラフまたはマップで自分のストーリーを共有
![GO801_GNI_AccessWorldData_Card4_Image1_GpmDAkq.jpg](https://storage.googleapis.com/media-newsinitiative/images/GO801_GNI_AccessWorldData_Card4_Image1_GpmDAkq.original.jpg)
![GO801_GNI_AccessWorldData_Card4_Image2_LDLBjoK.jpg](https://storage.googleapis.com/media-newsinitiative/images/GO801_GNI_AccessWorldData_Card4_Image2_LDLBjoK.original.jpg)
![GO801_GNI_AccessWorldData_Card4_Image3_7WN8X3c.jpg](https://storage.googleapis.com/media-newsinitiative/images/GO801_GNI_AccessWorldData_Card4_Image3_7WN8X3c.original.jpg)
![GO801_GNI_AccessWorldData_Card4_Image4_yvrw4rb.jpg](https://storage.googleapis.com/media-newsinitiative/images/GO801_GNI_AccessWorldData_Card4_Image4_yvrw4rb.original.jpg)
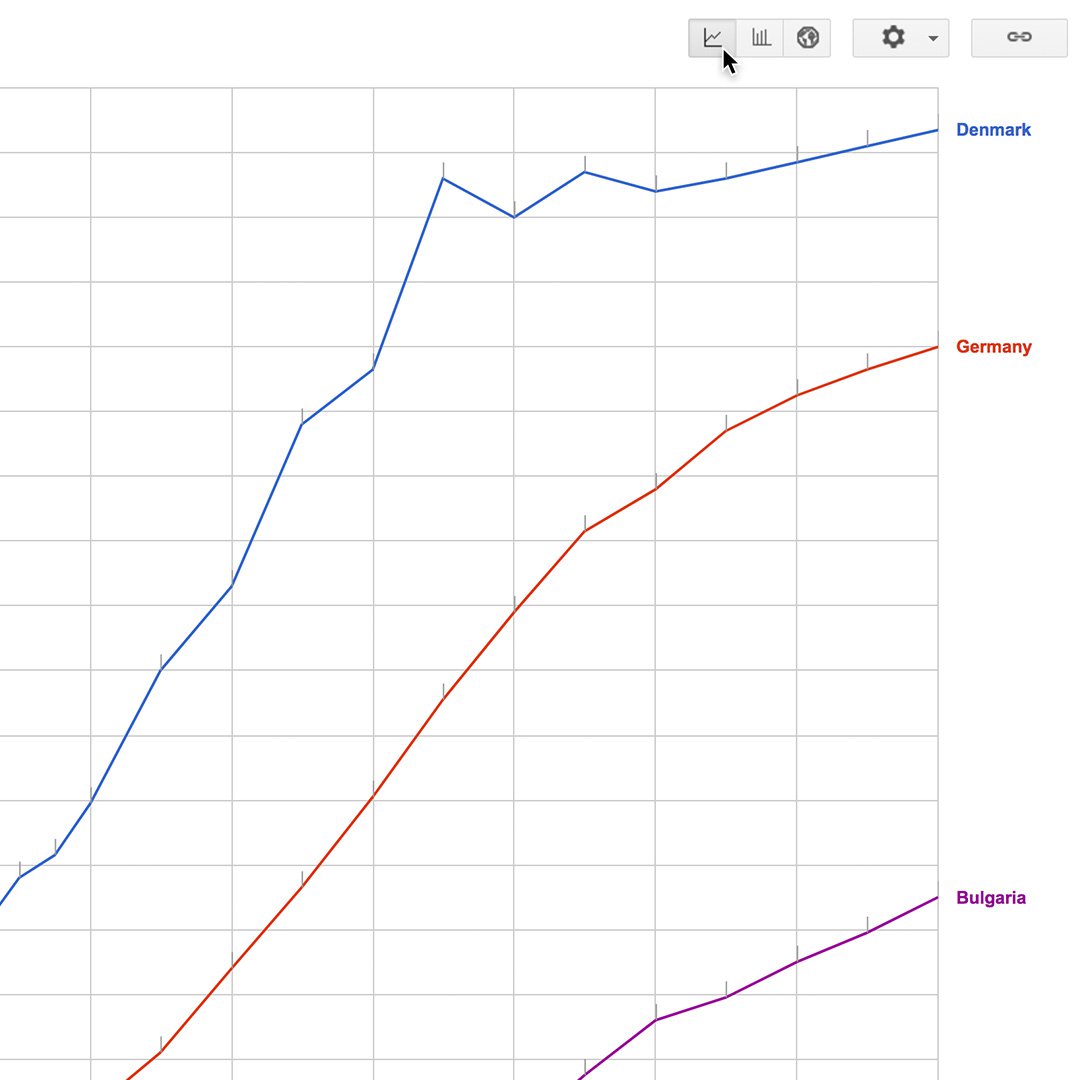
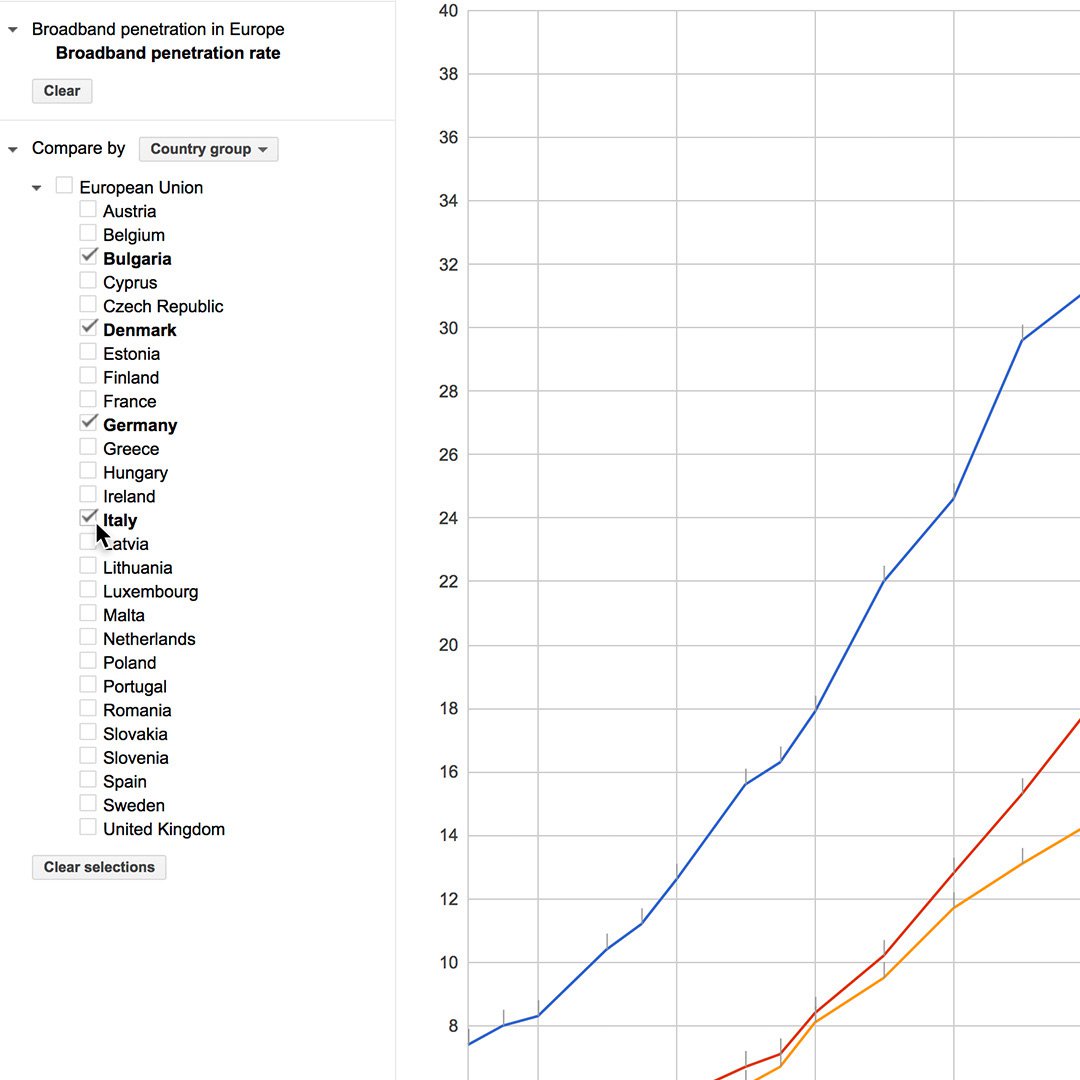
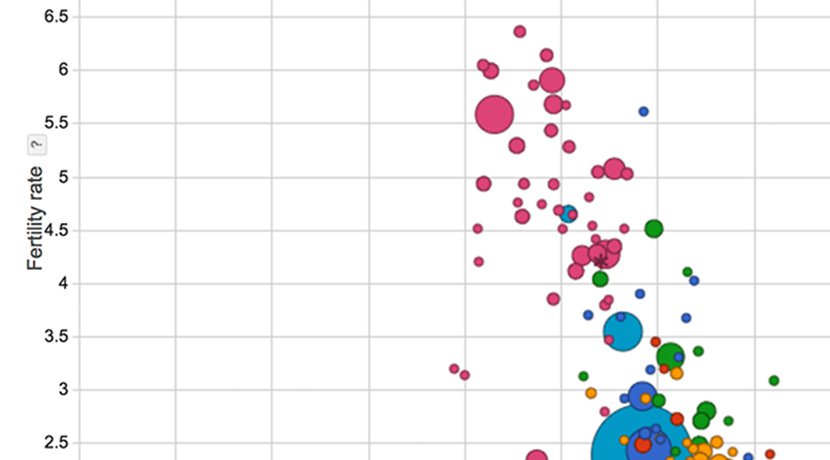
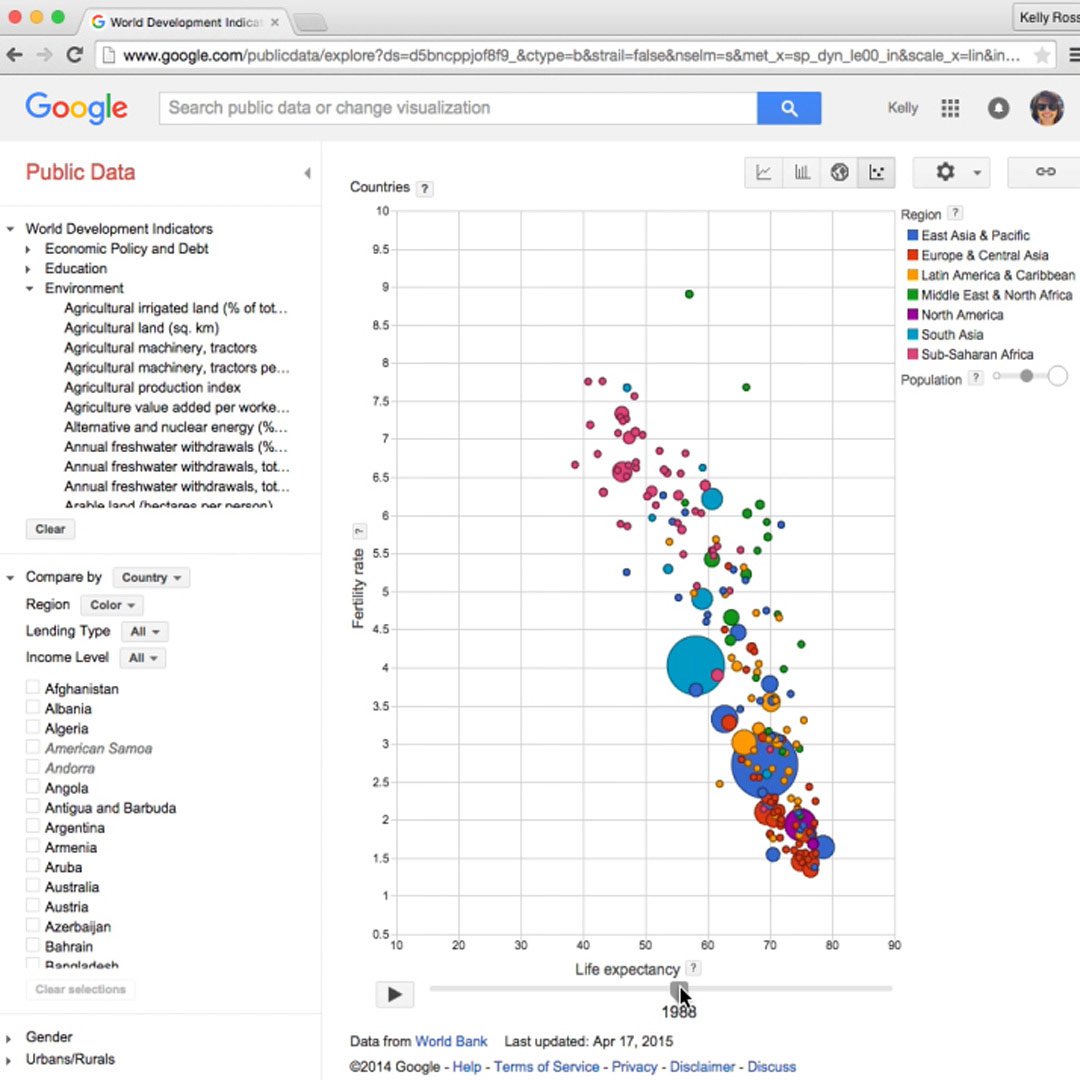
統計において、ビジュアルは時にとても有効です。Google Public Data Explorerでは、ビジュアル化は効果的です。時間の中での変化を見たり、トピックを変えたり、エントリーの違いをハイライトしたり、スケールを変えたりできます。自分のストーリーで簡単にビジュアルを公開できます。
ビジュアルのタイプ(ライン、バー、マップ、バブル)を選びます。
表示、比較、フィルターをかけるために統計を選択します。
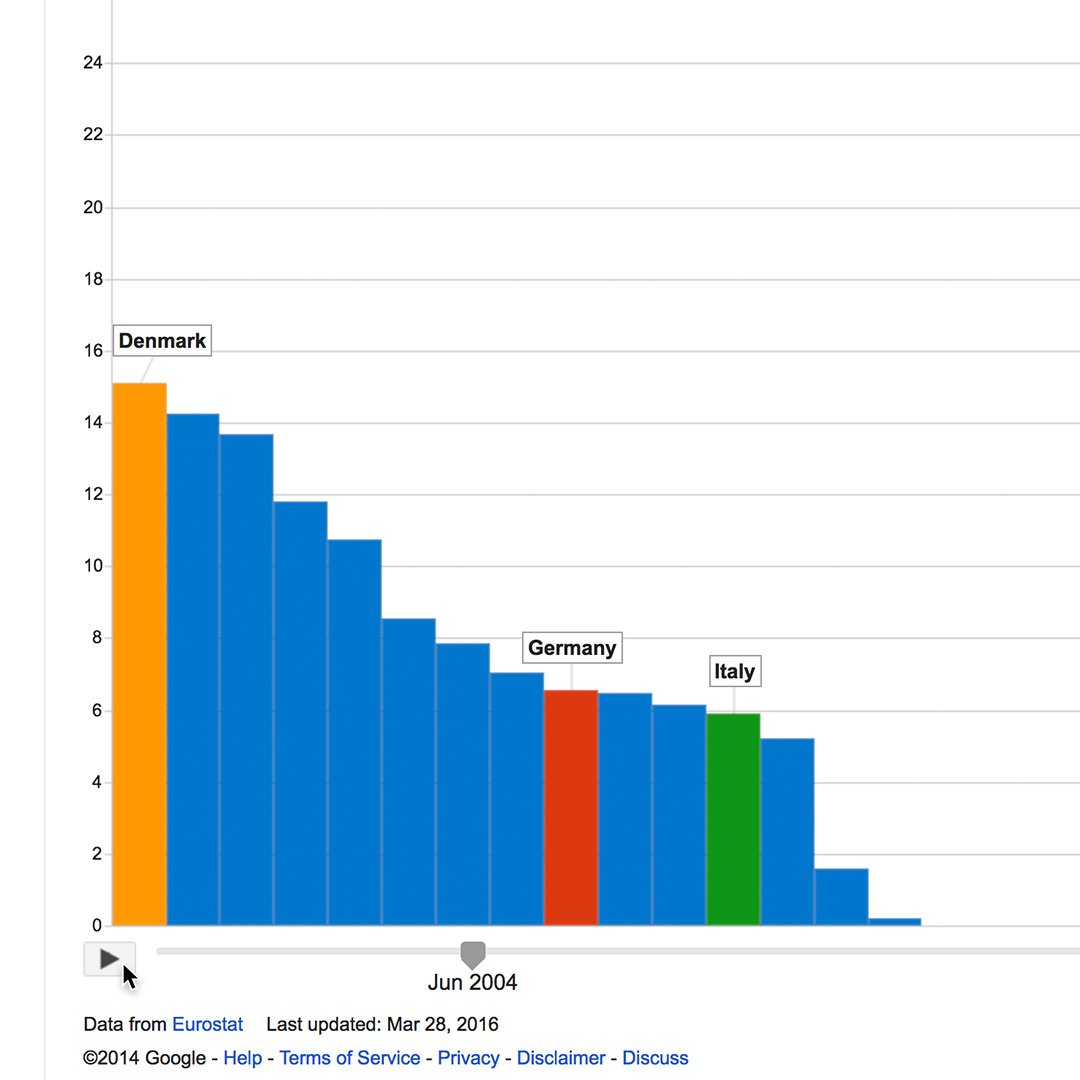
バー、マップ、バブルチャートでアニメーションを動かすためには再生をクリックします。
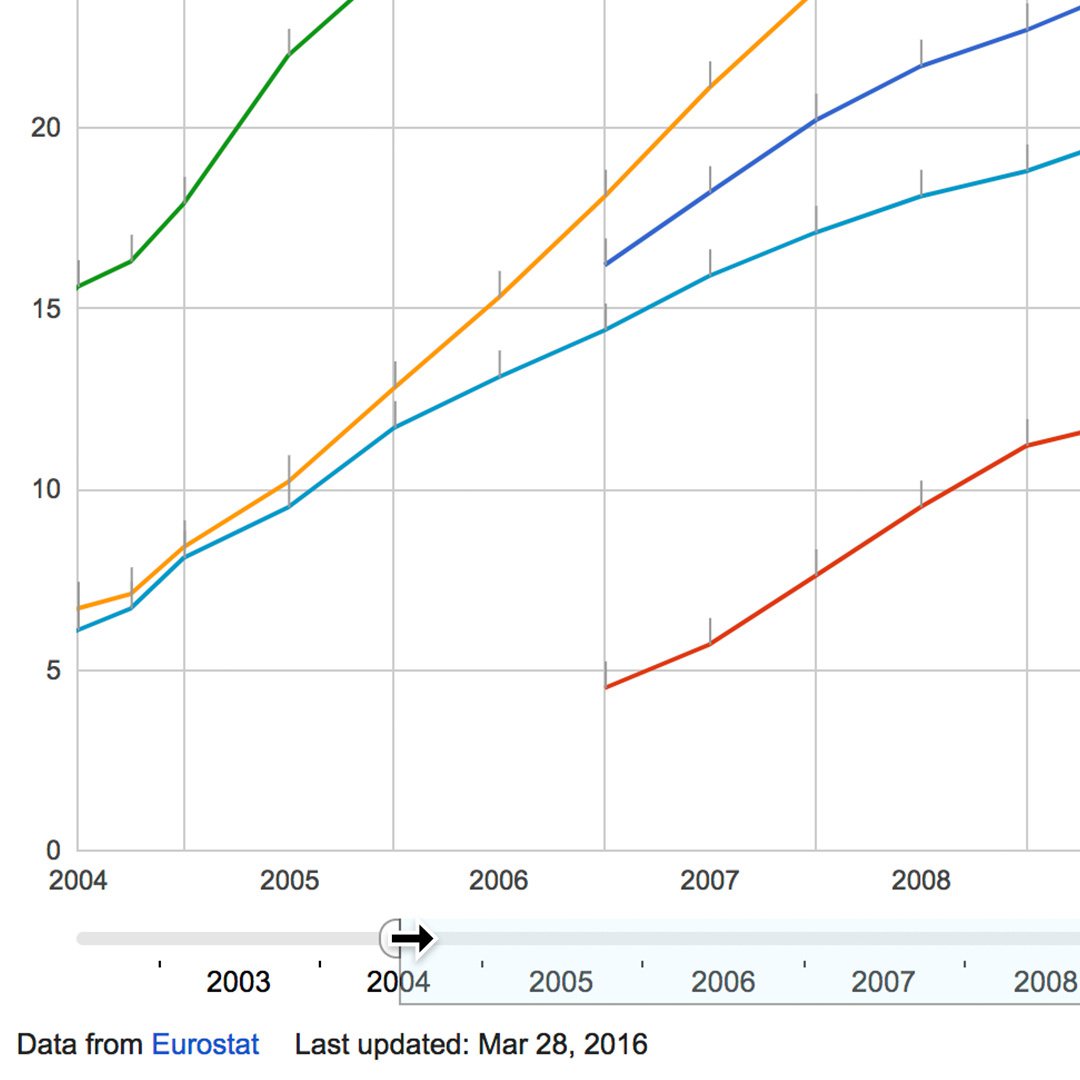
ラインチャートでは、タイムラインのタブをスライドさせることでx軸の時間範囲を調節します。
![GO801_GNI_AccessWorldData_Card4_Image1_GpmDAkq.jpg](https://storage.googleapis.com/media-newsinitiative/images/GO801_GNI_AccessWorldData_Card4_Image1_GpmDAkq.original.jpg)
![GO801_GNI_AccessWorldData_Card4_Image2_LDLBjoK.jpg](https://storage.googleapis.com/media-newsinitiative/images/GO801_GNI_AccessWorldData_Card4_Image2_LDLBjoK.original.jpg)
![GO801_GNI_AccessWorldData_Card4_Image3_7WN8X3c.jpg](https://storage.googleapis.com/media-newsinitiative/images/GO801_GNI_AccessWorldData_Card4_Image3_7WN8X3c.original.jpg)
![GO801_GNI_AccessWorldData_Card4_Image4_yvrw4rb.jpg](https://storage.googleapis.com/media-newsinitiative/images/GO801_GNI_AccessWorldData_Card4_Image4_yvrw4rb.original.jpg)
-
-
How to make them using WordPress
レッスンWordPress is the standard for so many content makers, and now the ability to create Web Stories is built right into the platform. -
動画: ジャーナリストにとっての Google Earth とマッピング テクノロジー
レッスンジャーナリストが Google Earth とマッピング テクノロジーを活用する方法について説明します