データのビジュアル化:イルグラムの紹介
データをマッピングする新しい方法。
無料のデータビジュアル化ツール
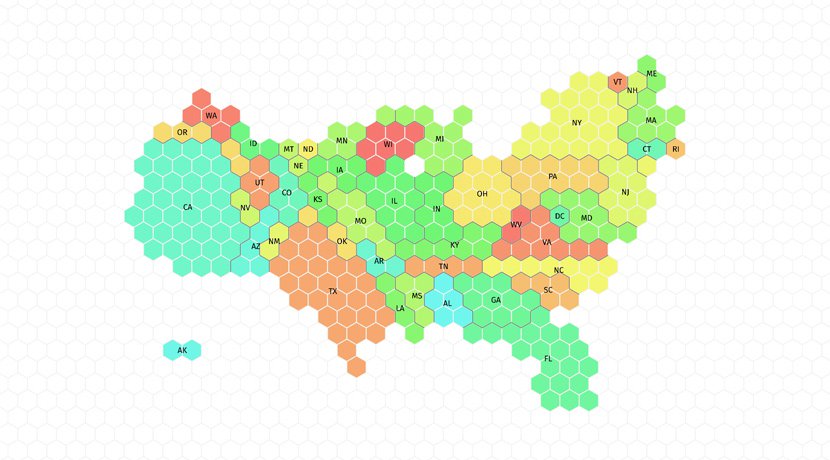
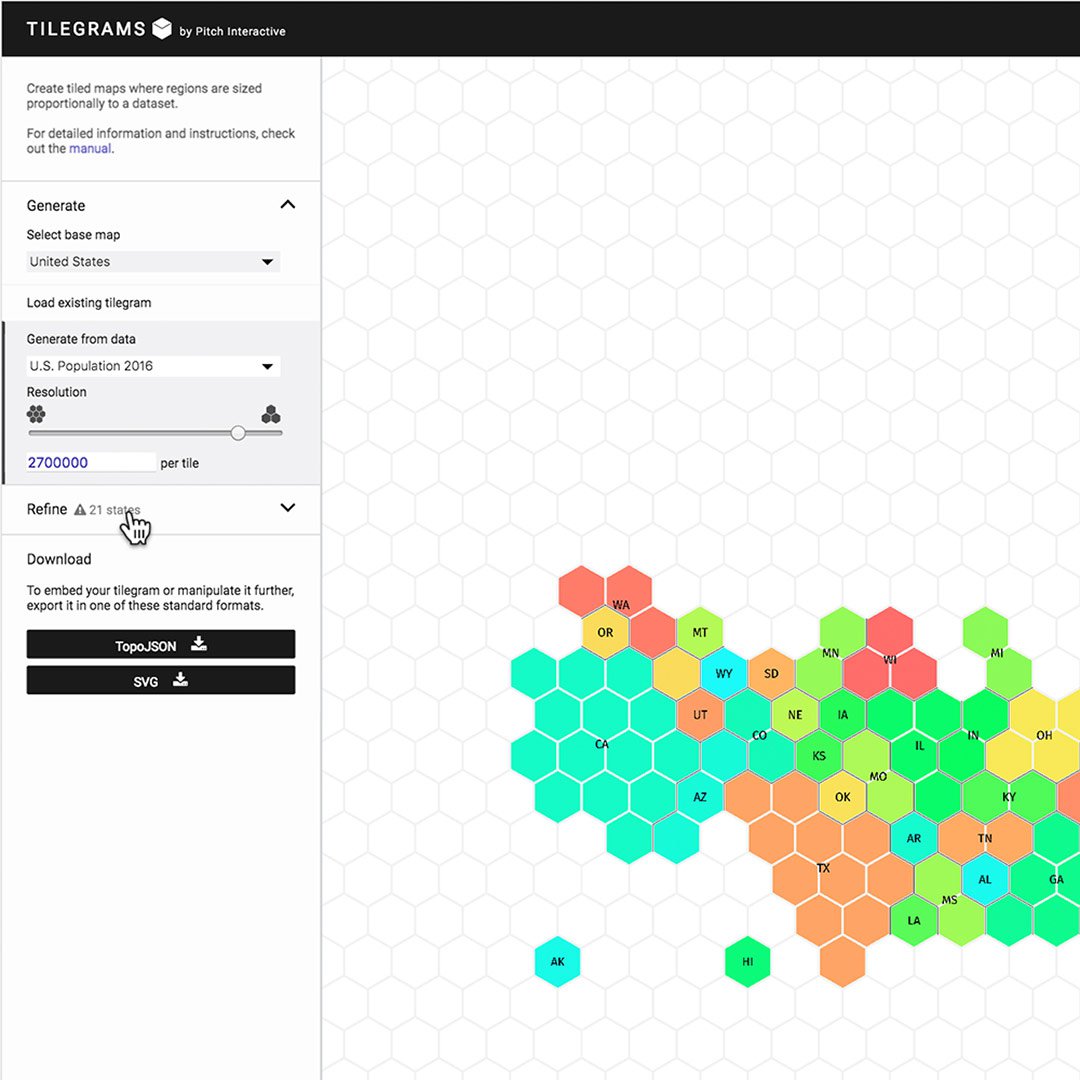
「統計地図の断片」の省略であるタイルグラムは、地域がデータセットに比例するタイルで構成されたマップです。タイルグラムは人口統計データをかつての地理マップより正確に表現するものですが、似た形を保持しています。例えば、このアメリカのタイルグラムは、人口を表しているものですが、各地域に何人が暮らしているのかがよりわかりやすく表しています。この段階ではアメリカの領域はまだ認識可能です。タイルグラムは人口関連データだけではなく、地理的データにおけるほぼどんなタイプの比例比較もビジュアル化することができます。ここからツールを確認しましょう:
https://pitchinteractiveinc.github.io/tilegrams/
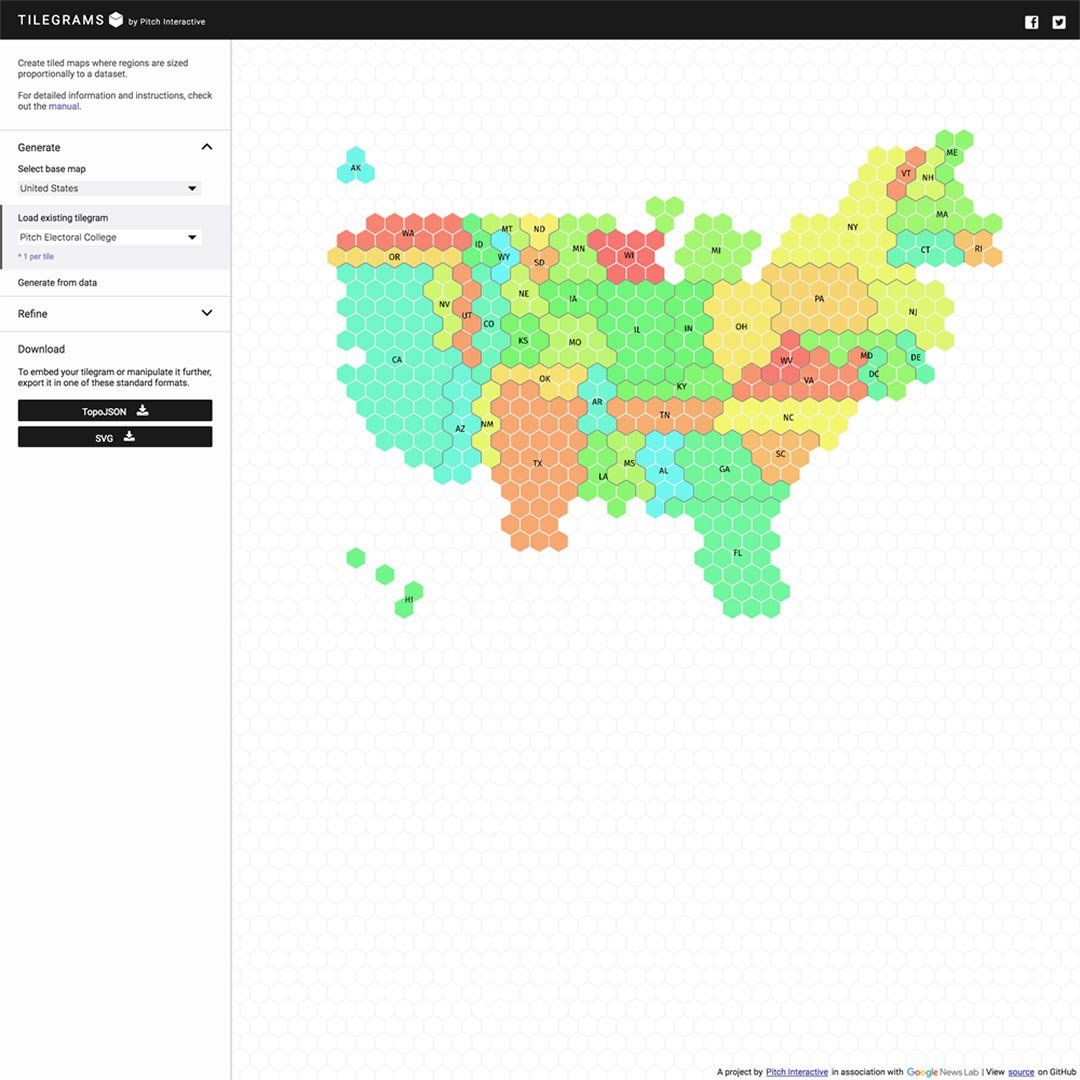
既存のタイルグラムにアクセス
タイルグラムはPitch Interactiveによって開発れた無料ツールです。
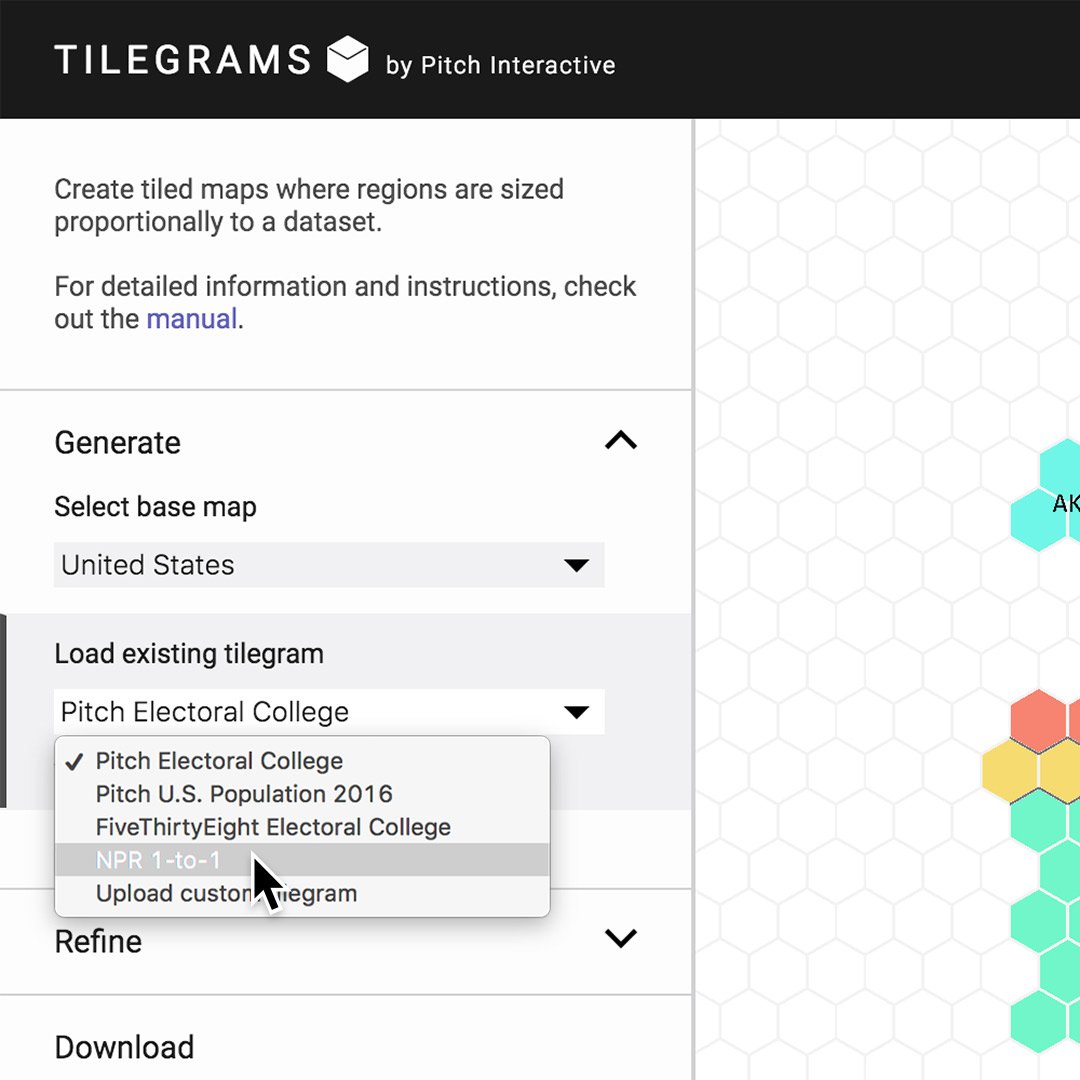
Pitch、NPR、FiveThirtyEightによるアメリカのマップを含む既存のタイルグラムで確認することができます。
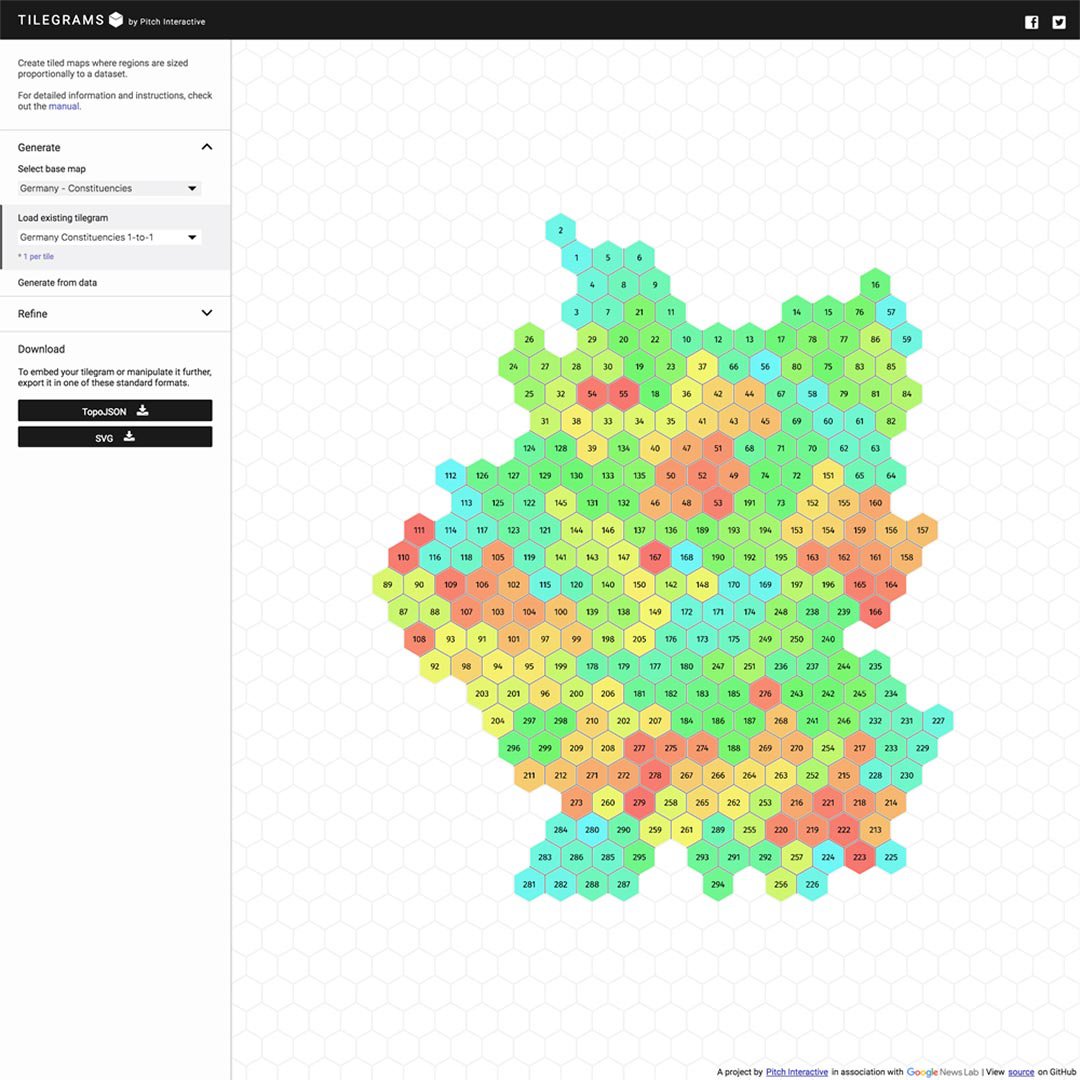
ドイツとフランス、そしてその他の国々のマップも見ることができます。
既存のタイルグラムを改良

タイルグラムはビジュアルを編集するアルゴリズムを使っています。従って、必然的に不正確なビジュアルを表示する可能性があります。完全で正確なストーリーにするために、あなたのタイルグラムを修正するいくつかの方法があります。 アップロードしたものを修正する方法はいくつもあります。
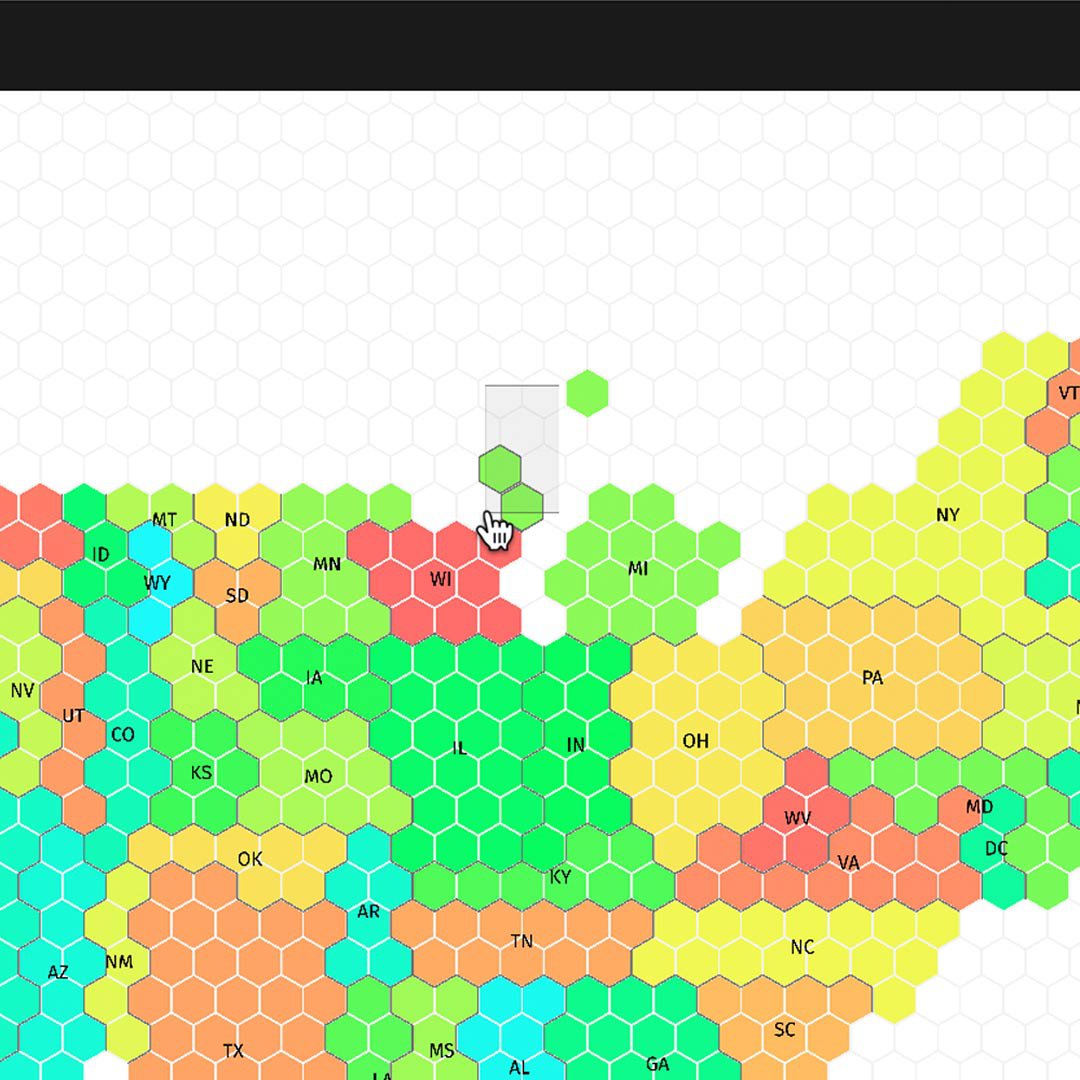
タイルのどれかをクリック、ドラッグして動かします。
複数のタイルを動かすには、周囲の長方形マーキーをクリック、ドラッグして動かします。
特定の地域を動かすには、すべてのタイルを選択するためにタイルのどれかをダブルクリックし、全ての地域をドラッグします。
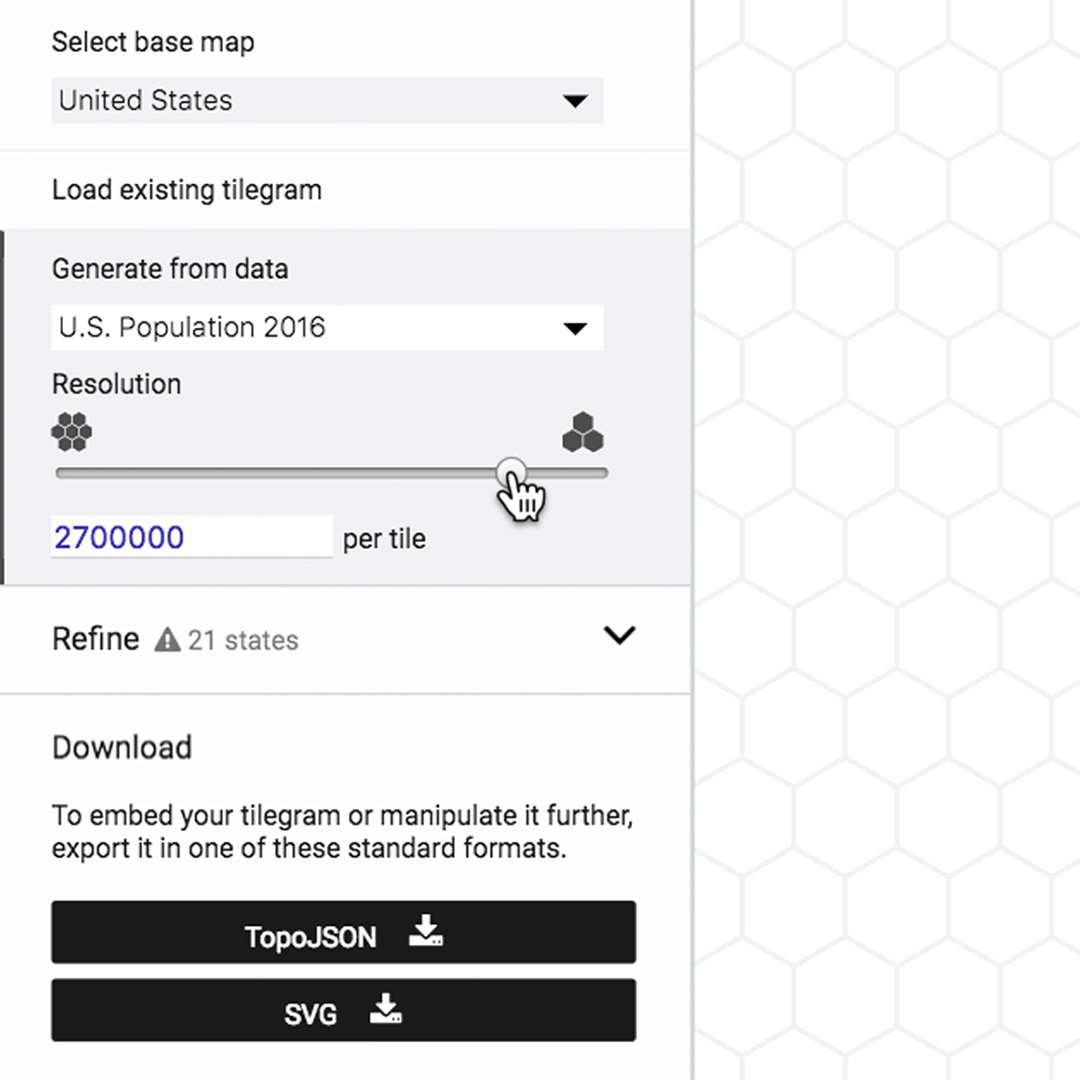
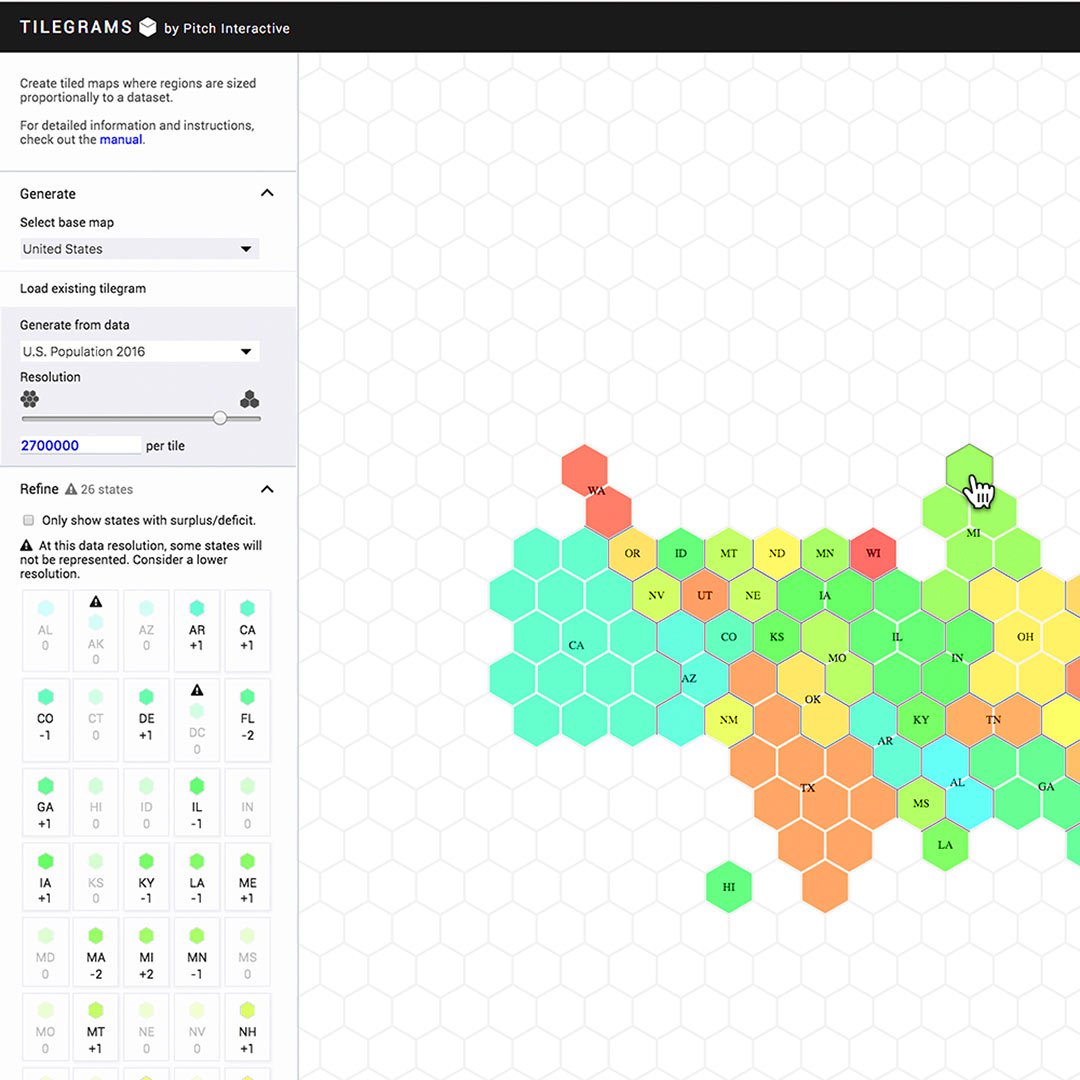
解像度を調整するには、データから生成をクリックし、スライダーを使います。
統計的正確性を確保
自分のデータを改善するのにともない、マップは変更され、間違いが明らかになることもあります。このような状況はタイルグラムではよく起こります。正確さと認識できる結果の両方を備えることは困難だからです。自分のデータの作成を開始したらトレードオフを経験するでしょう。
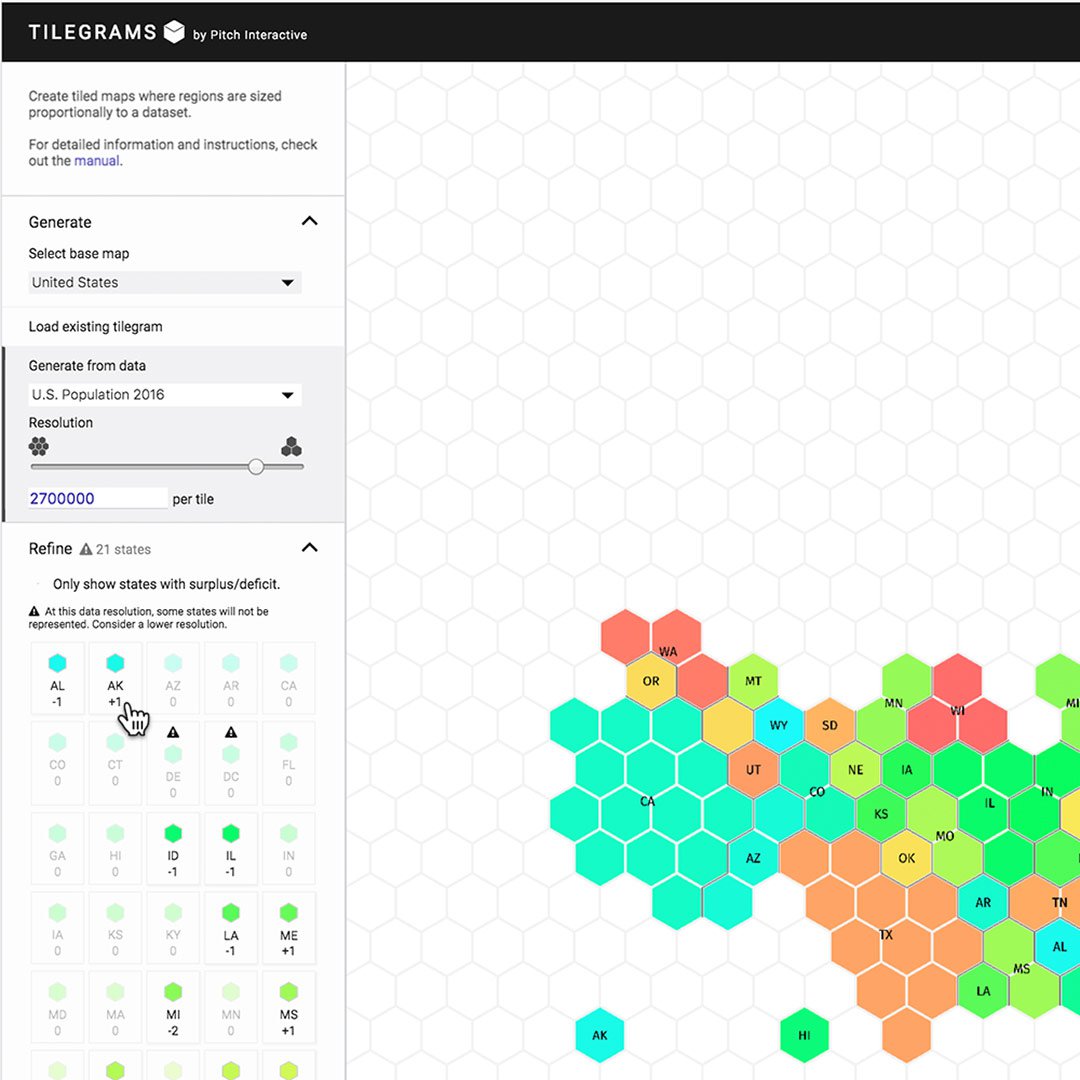
改良をクリックします。
「州タイル」の下に、各州の名前と番号、六角形のリストがあります。番号は、データセットに基づくマップ上に現在存在する地域のタイル数と、本来の数との差異を表しています。数がポジティブである場合は、その地域が多すぎるタイルをマップ上に持っているということです。ネガティブである場合は、タイル数が不足しているということです。警告サインが出ていたら、指定の解像度では、その地域のデータがマップ上で1つのタイルを作るために十分でないことを表しています。
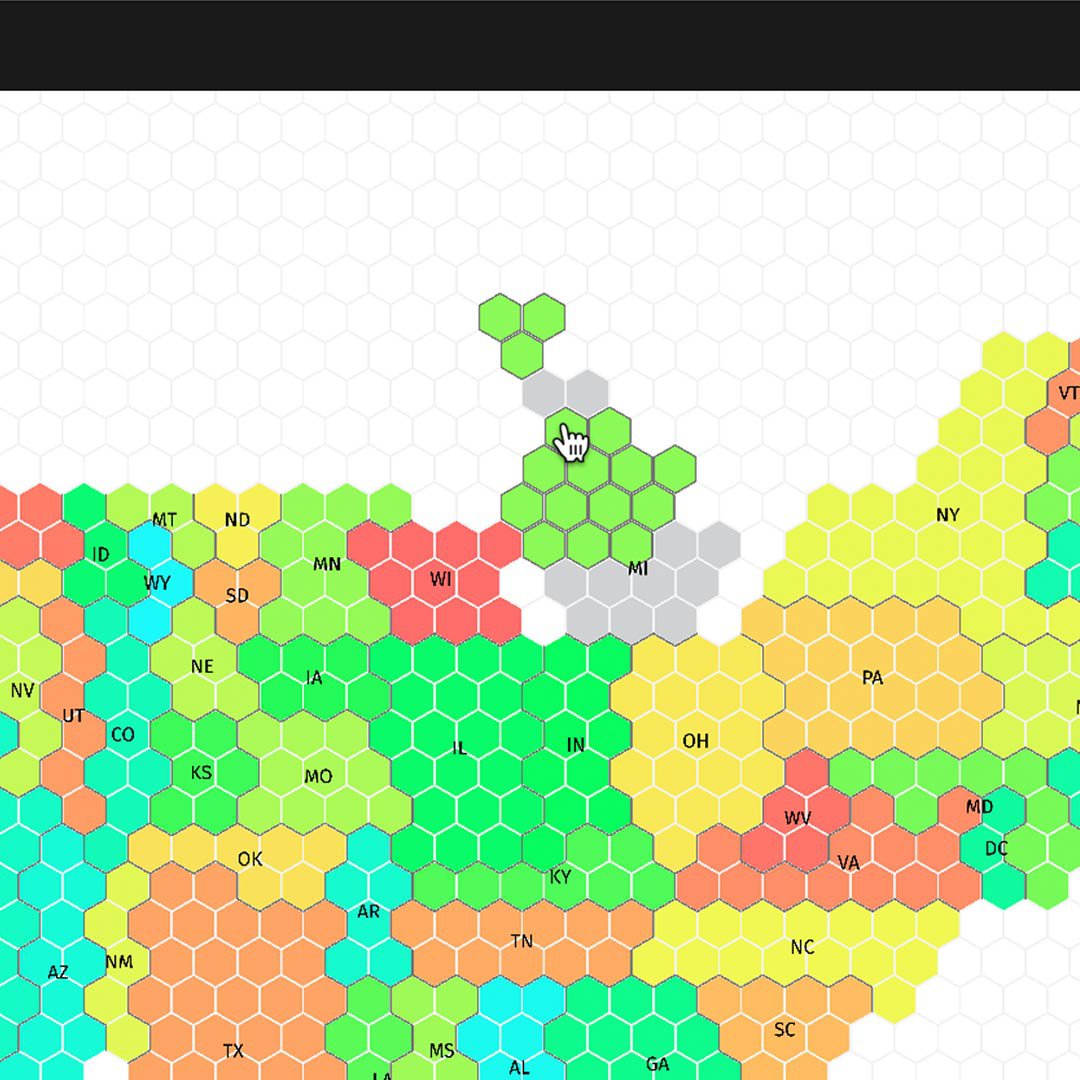
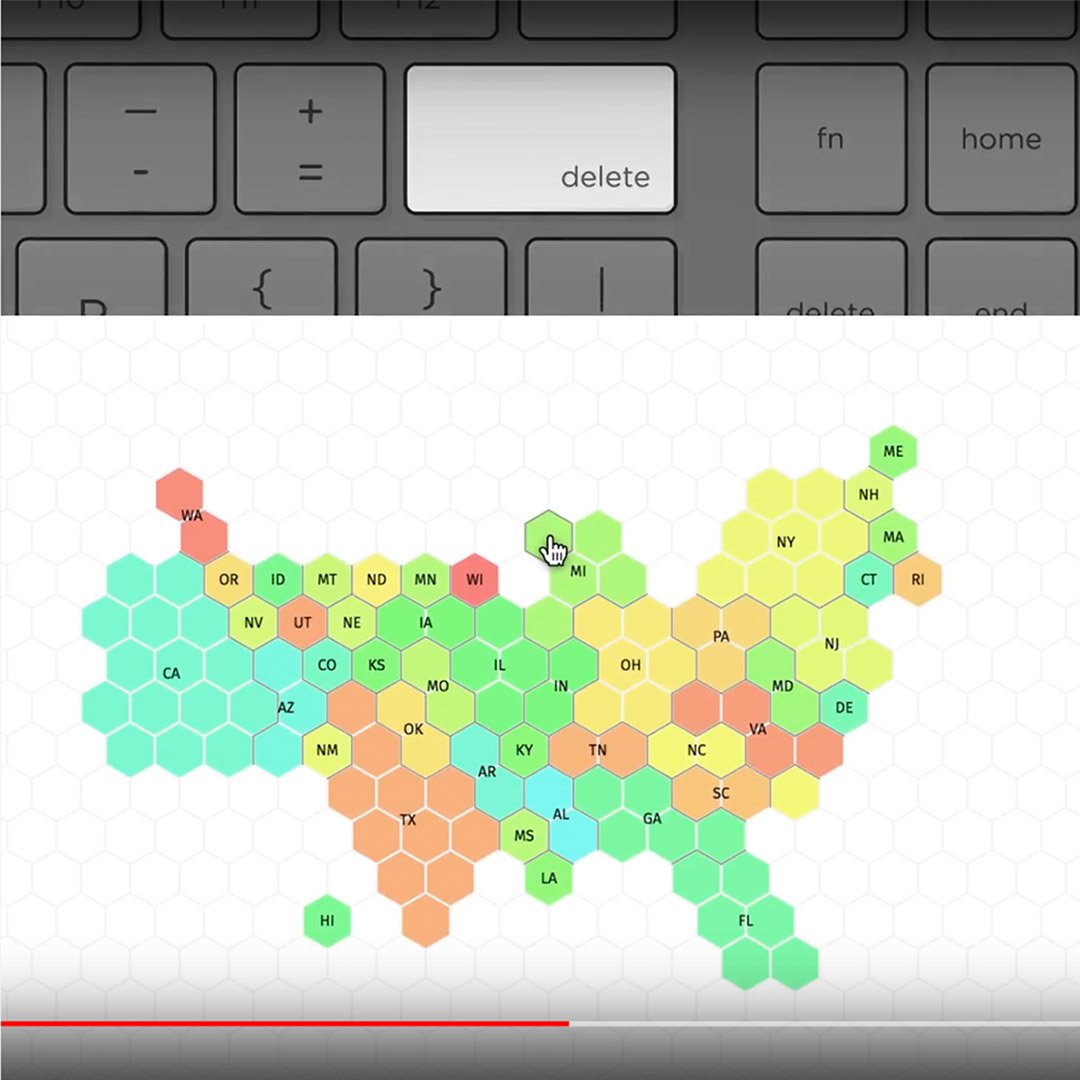
マップからタイルを削除するには、キーボードの削除ボタンを押してください。
タイルを追加するには、改良を選び、左サイドバーから六角形をクリックし、マップにドラッグします。
既存のタイルグラムをエクスポート
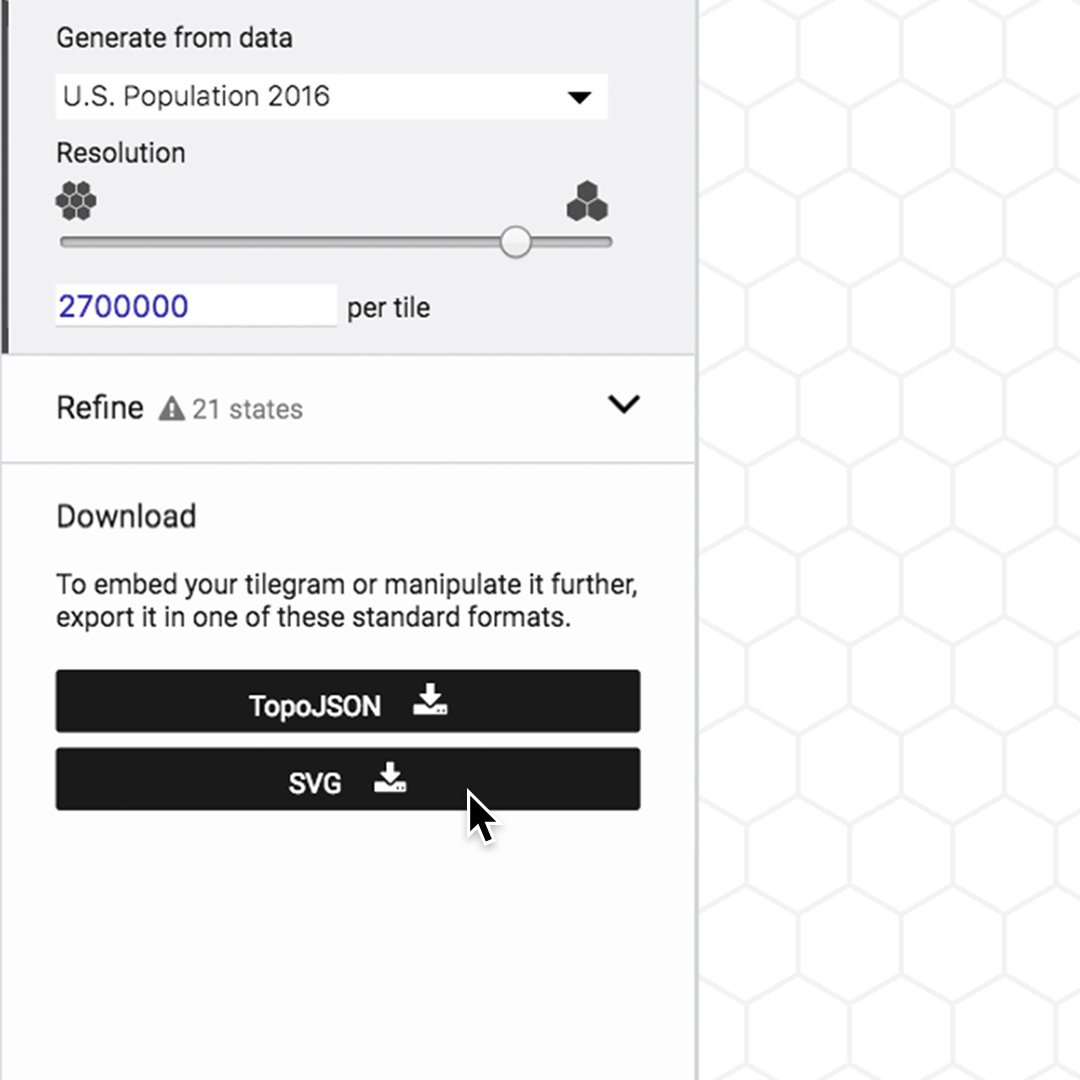
タイルグラムが気に入ったら、エクスポートすることができます。デザインソフトでデータを使うには、左下のボタンからSVGファイルタイプを選びます。ウェブアプリケーションにエクスポートするには、デベロッパーはTopoJSONを選んでください。
タイルグラム基本をさらに確認するには、ツールからメディアポストをご覧ください