5분 완료를 위해
Google의 분석 도구를 활용해 독자층 구축하기

독자에 관한 데이터를 기반으로 더 효과적인 결정을 내리세요.
Google의 분석 도구에는 어떤 것이 있나요?
독자에 관해 얼마나 알고 계시나요?
연구에 따르면 독자 데이터를 사용하지 않는 언론사에 비해 독자를 파악하고 있는 언론사는 다음과 같은 차이를 보인다고 합니다.
- 20% 더 많은 구독 수익 달성
- 20% 더 높은 가격으로 디지털 광고 판매
- 40% 더 많은 기사 클릭수 달성
독자층을 구축하는 데 어떤 Google 도구가 도움이 되나요?
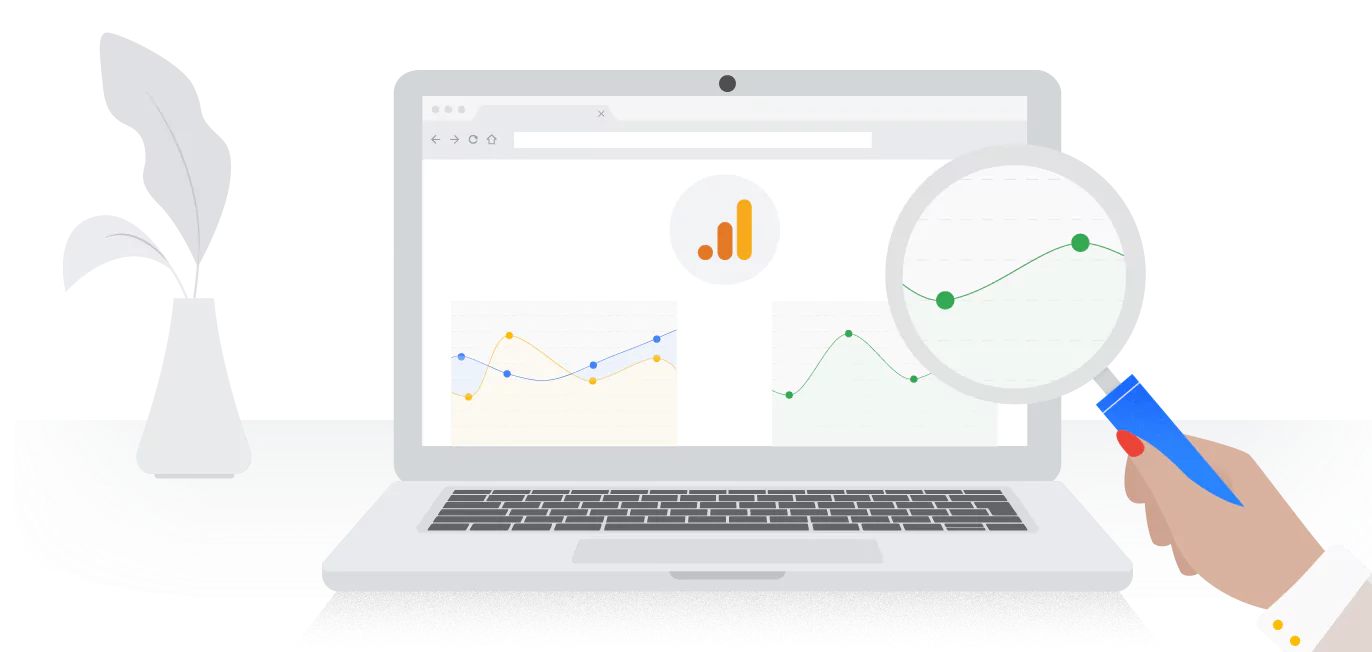
- Google 애널리틱스
- News Consumer Insights
- Realtime Content Insights
- Google Looker Studio
News Consumer Insights, Realtime Content Insights, Google Looker Studio를 사용하려면 Google 애널리틱스 계정이 필요합니다.
News Consumer Insights를 활용해 데이터에 기반하여 결정 내리기
독자 수를 늘리거나 뉴스 사이트에 더 오래 머무르게 하려면 어떻게 해야 하나요?
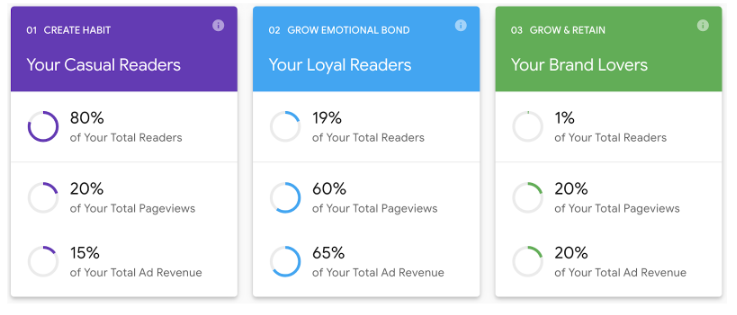
News Consumer Insights는 Google 애널리틱스 데이터를 분석하여 독자들을 다음과 같이 참여도별로 분류하고 조직에서 독자층을 성장시키도록 돕습니다.
- 일반 독자
- 충성도 높은 독자
- 브랜드 애호가
News Consumer Insights는 독자 데이터에 기반해 참여도를 높일 방법을 추천해 주므로 수익을 증대시킬 수 있습니다.
Realtime Content Insights를 활용해 실적이 가장 좋은 기사 파악하기
독자층은 어떤 뉴스에 관심을 두나요?
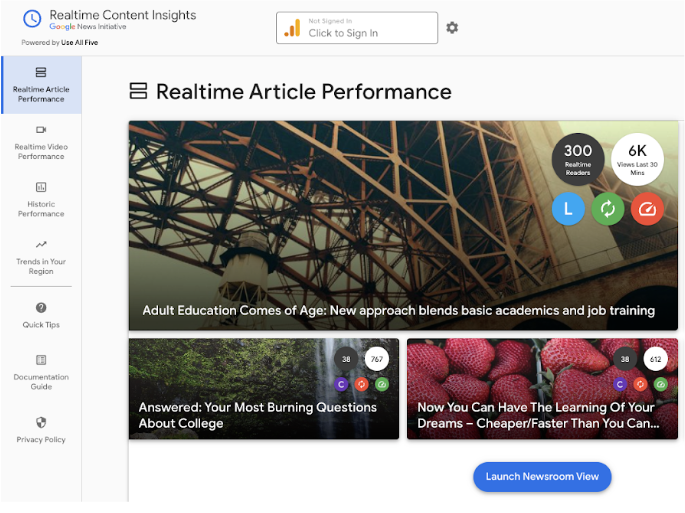
Realtime Content Insights는 Google 애널리틱스 데이터를 분석하여 다음 내용을 파악합니다.
- 실시간 실적과 역대 실적이 가장 좋은 기사
- 가장 참여도가 높은 독자가 읽은 기사
- 근처에 있는 사람들이 Google과 YouTube에서 검색하는 내용
Google Looker Studio를 활용해 데이터 시각화하기
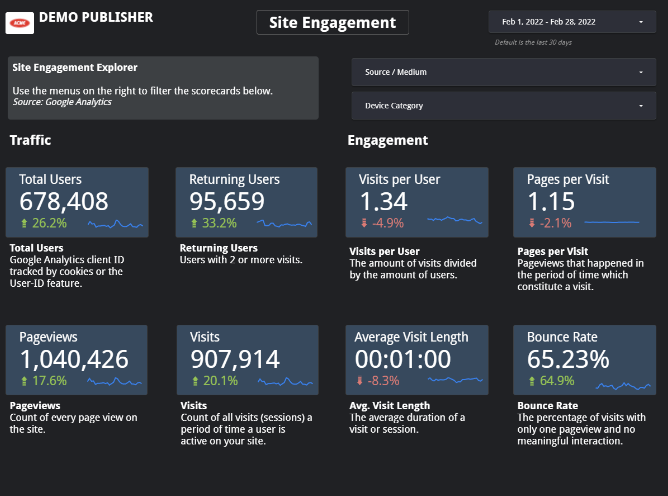
어떻게 데이터를 더 효과적으로 활용할 수 있나요?
Google Looker Studio를 사용하면 다음 작업을 수행할 수 있습니다
- Google 애널리틱스, Google Ads 및 기타 Google 제품의 데이터 수집
- 한곳에서 데이터 시각화
- 자동화된 보고를 통해 팀에 최신 정보 제공
이 강의가 얼마나 만족스러우셨나요?
의견을 보내주시면 Google 뉴스 이니셔티브 강의를 지속적으로 개선하는 데 도움이 됩니다.
예, 진행 중입니다
추천 서비스