Wizualizacja danych: Zaawansowane kartogramy anamorficzne.
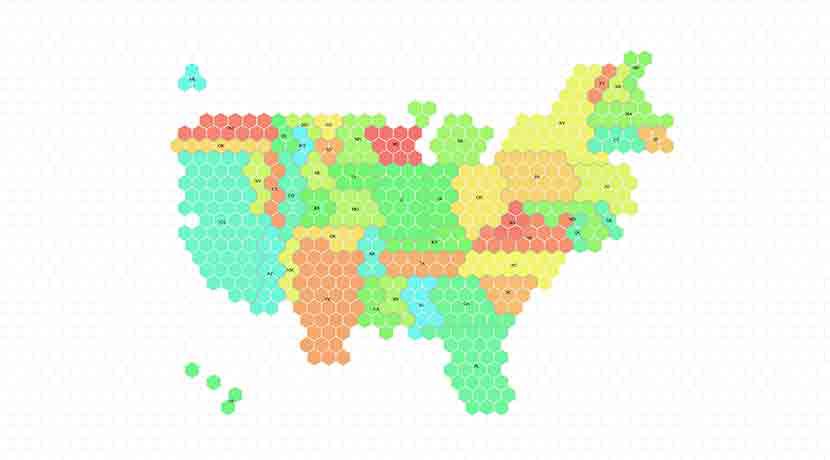
Generowanie własnego kartogramu anamorficznego z danych.
Generowanie nowych kartogramów anamorficznych.
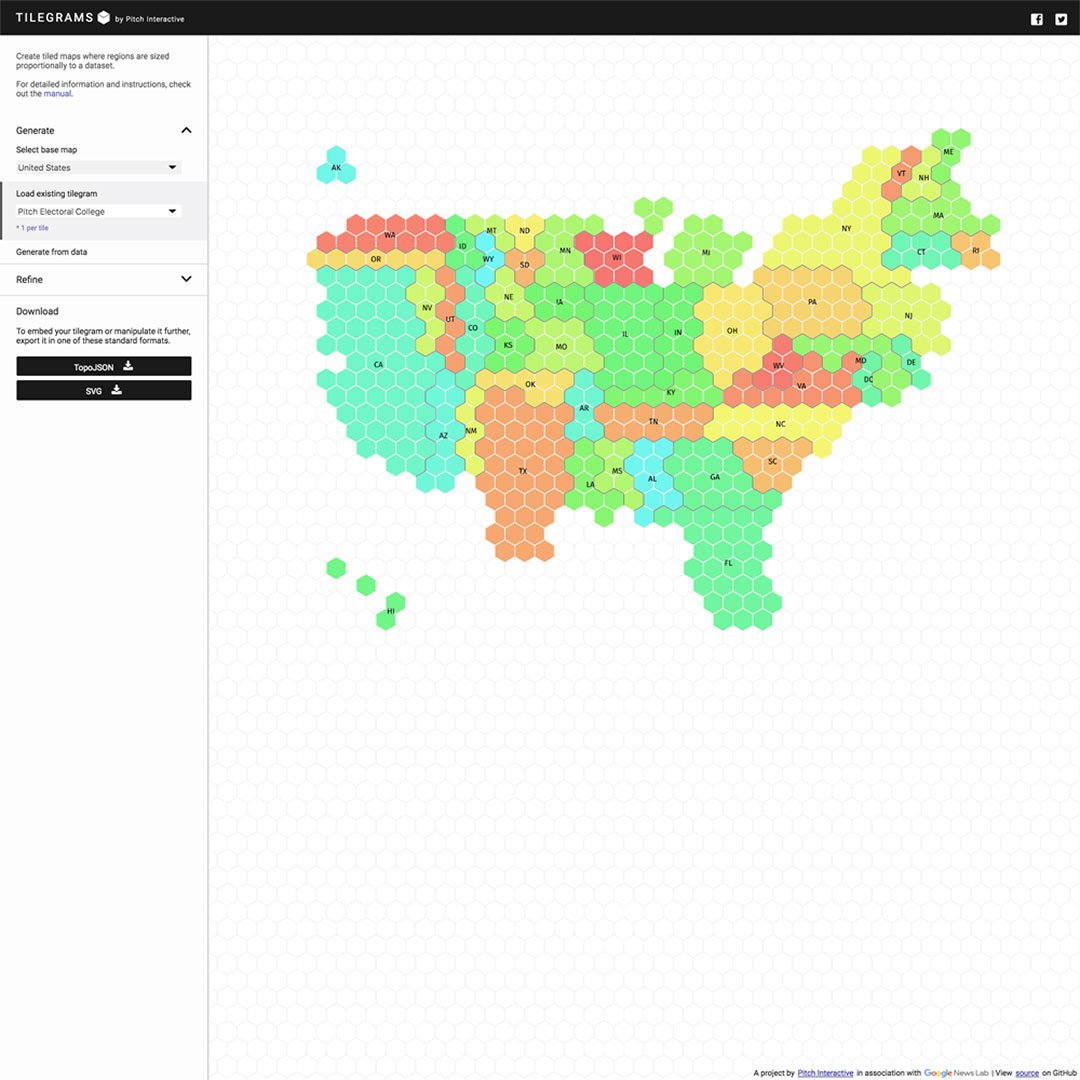
Możesz tworzyć własne kartogramy anamorficzne, modyfikując dane w dostępnych mapach bazowych lub przesyłając własne dane.
Najpierw dane.
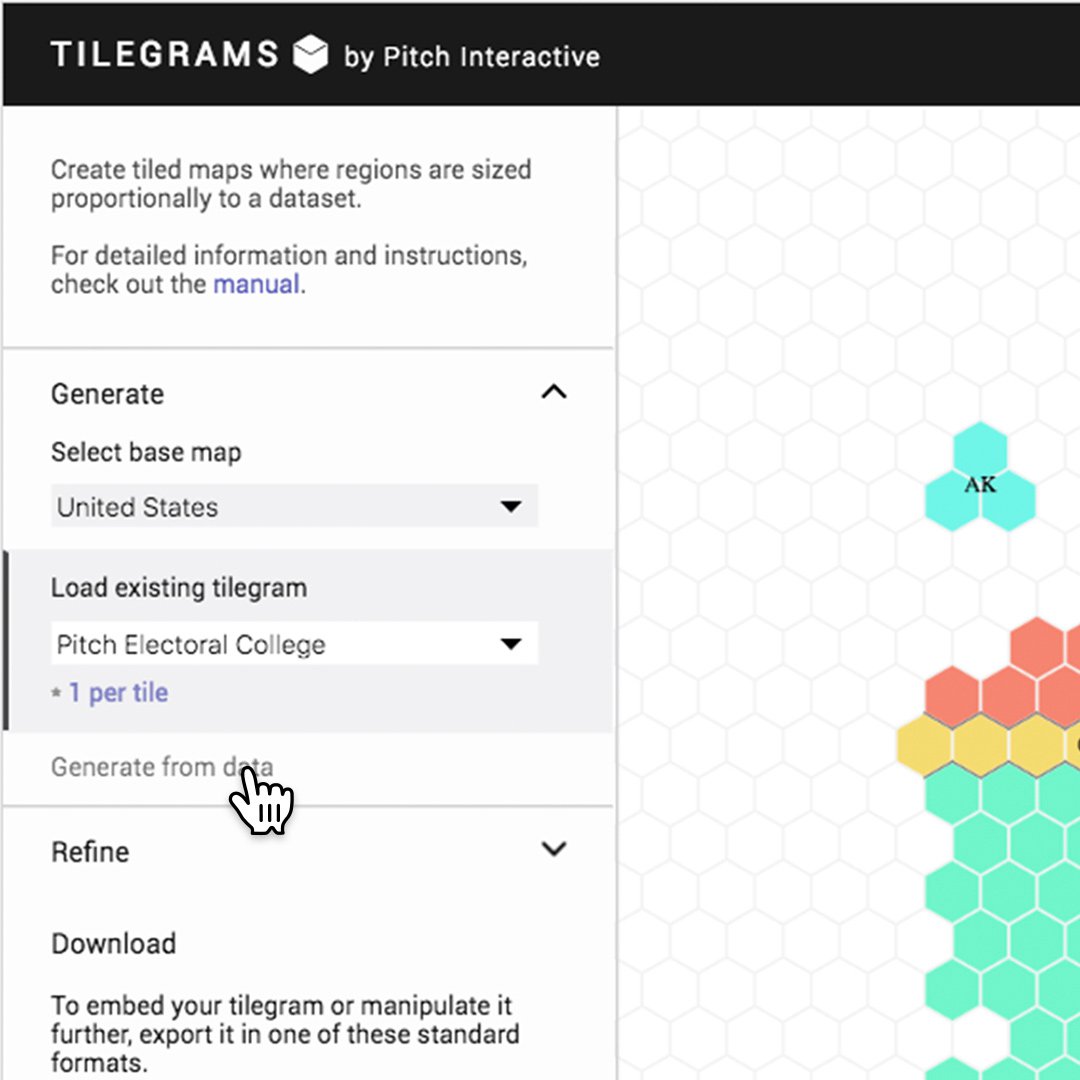
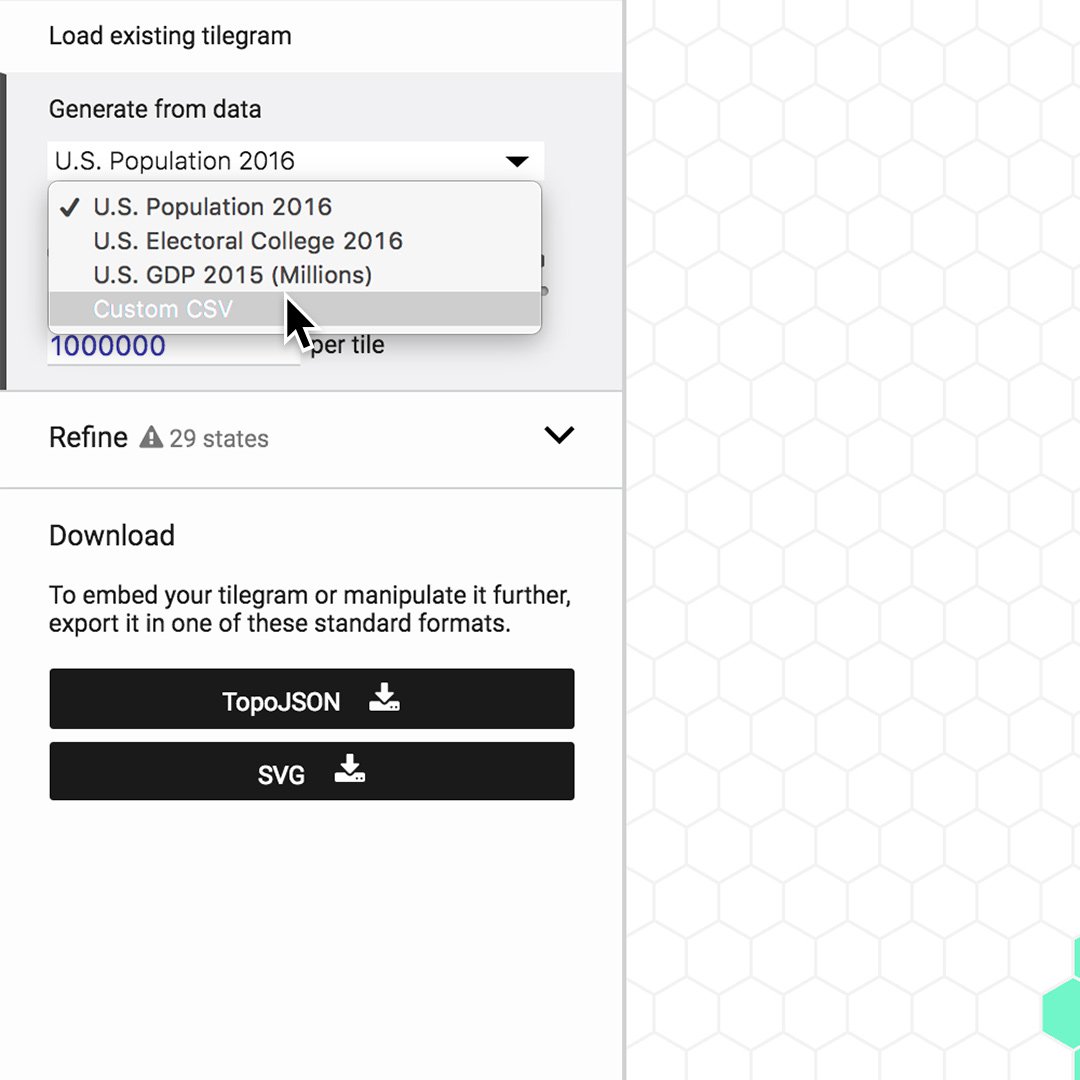
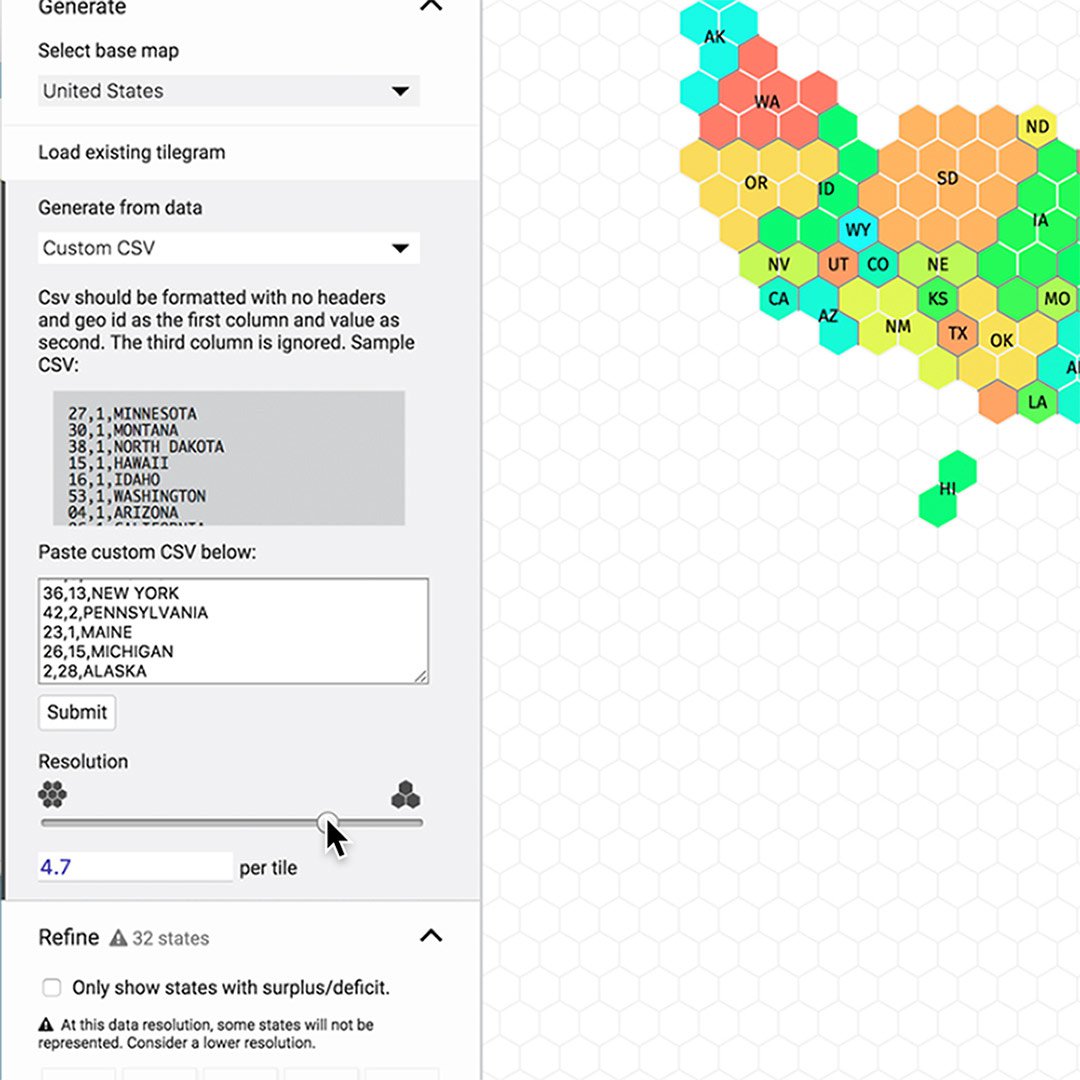
Rozpocznij od wybrania opcji Generuj z danych.
Klikając na rozwijane menu, zobaczysz, że masz do wyboru kilka opartych na danych z USA map bazowych.
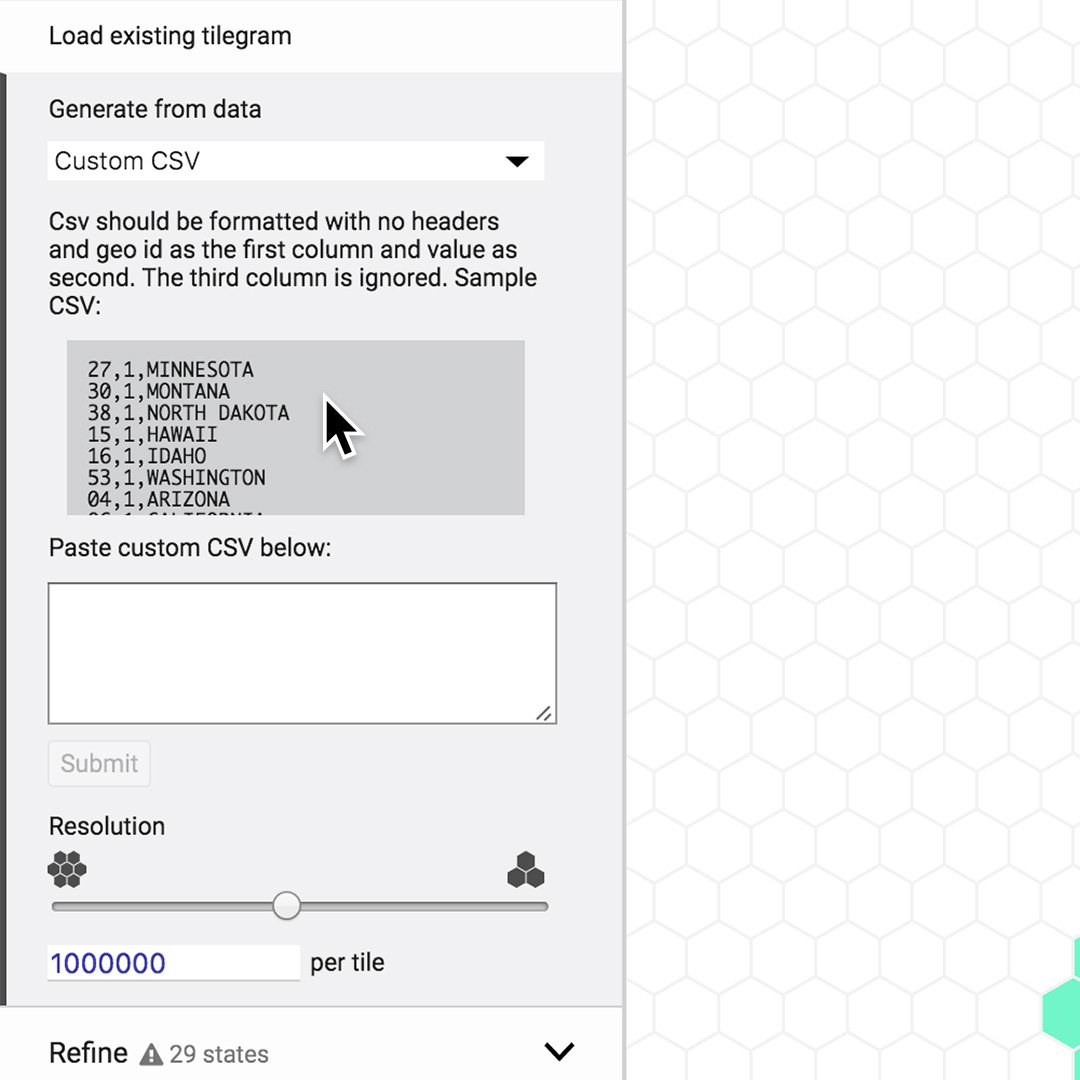
Możesz również wybrać Niestandardowy CSV, aby przesłać własny zbiór danych.
Znajdowanie geo-kodów ID dla różnych regionów.
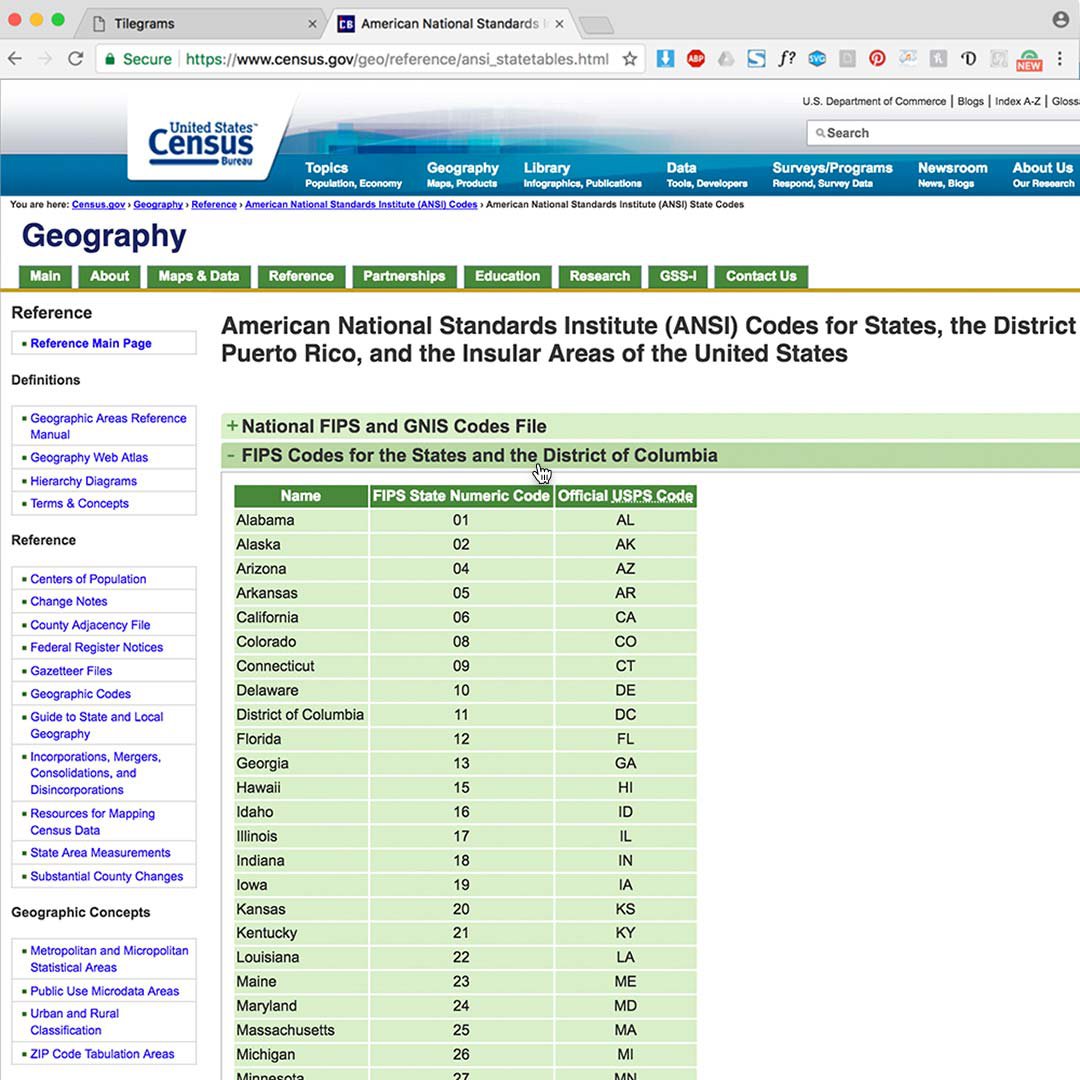
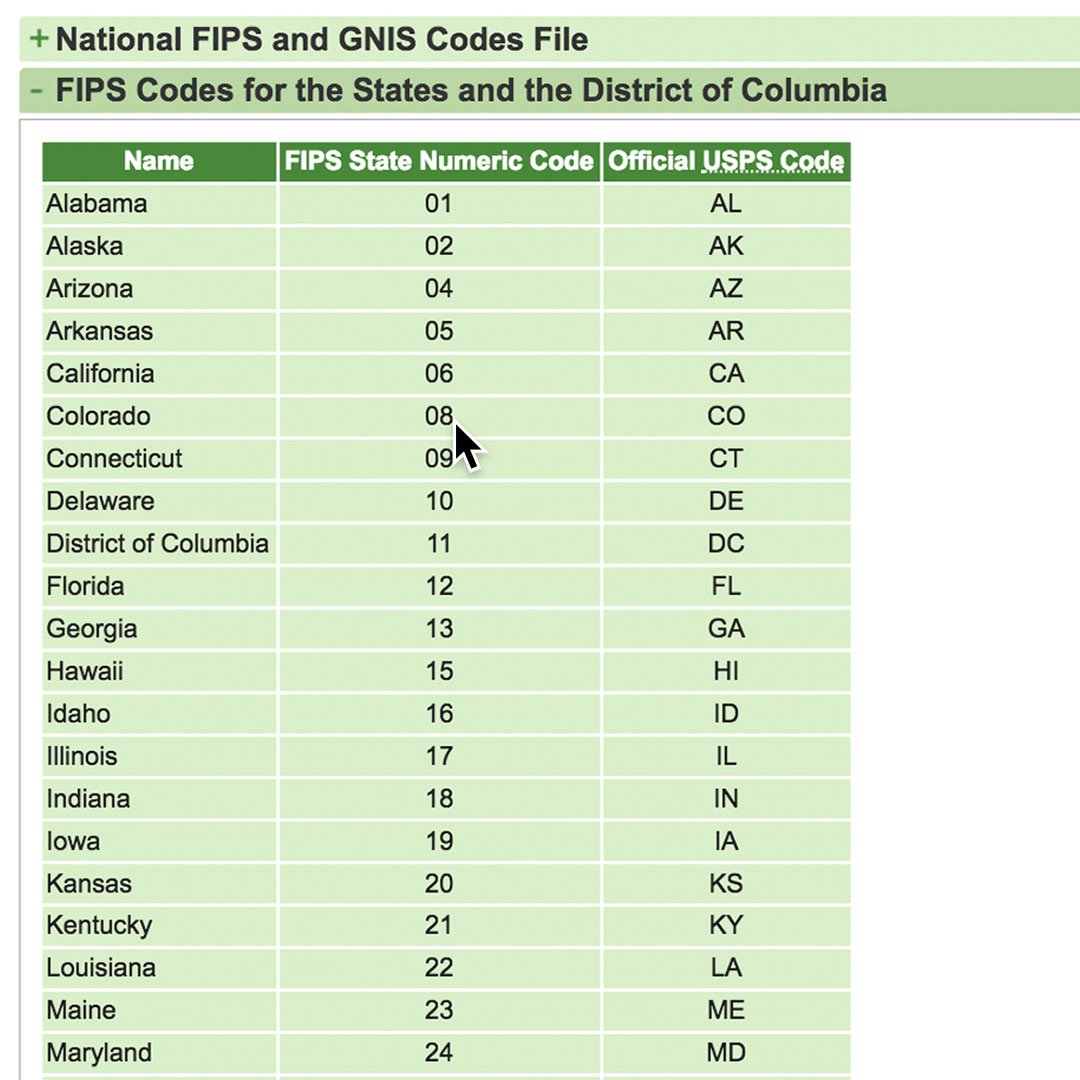
Aby wygenerować nowy kartogram anamorficzny, musisz znać jego geo-kody ID. Na przykład w Stanach Zjednoczonych stosuje się kody stanów FIPS do identyfikacji 50 stanów i dodatkowych terytoriów. Francja i Niemcy używają kodów ISO-3166-2.
Kliknij powyższy link. Na stronie głównej kliknij Kody FIPS dla stanów i dystryktu Kolumbii.
Kody poszczególnych stanów znajdziesz w środkowej kolumnie.Germany Geo ID dataset by Bundeswahlleiter
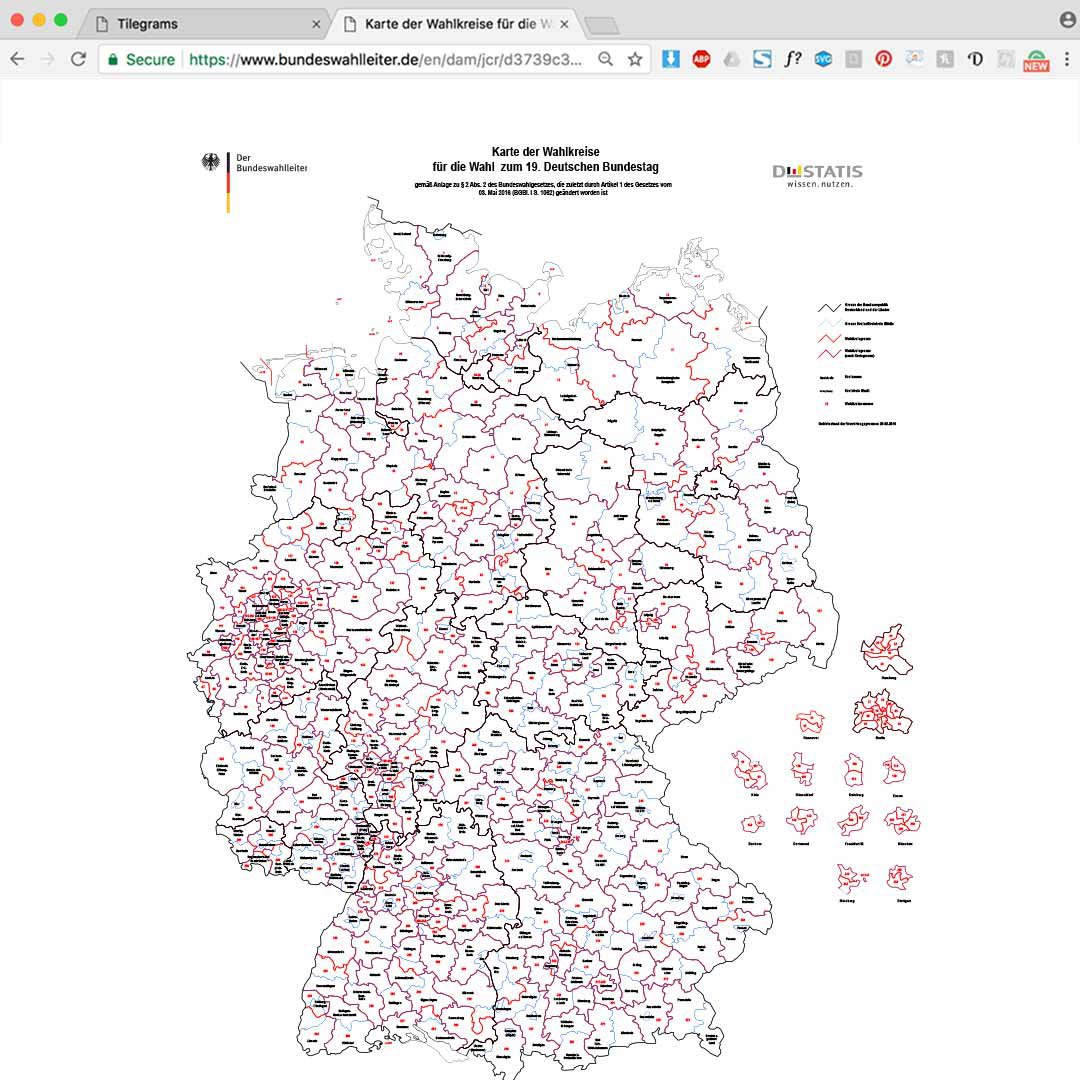
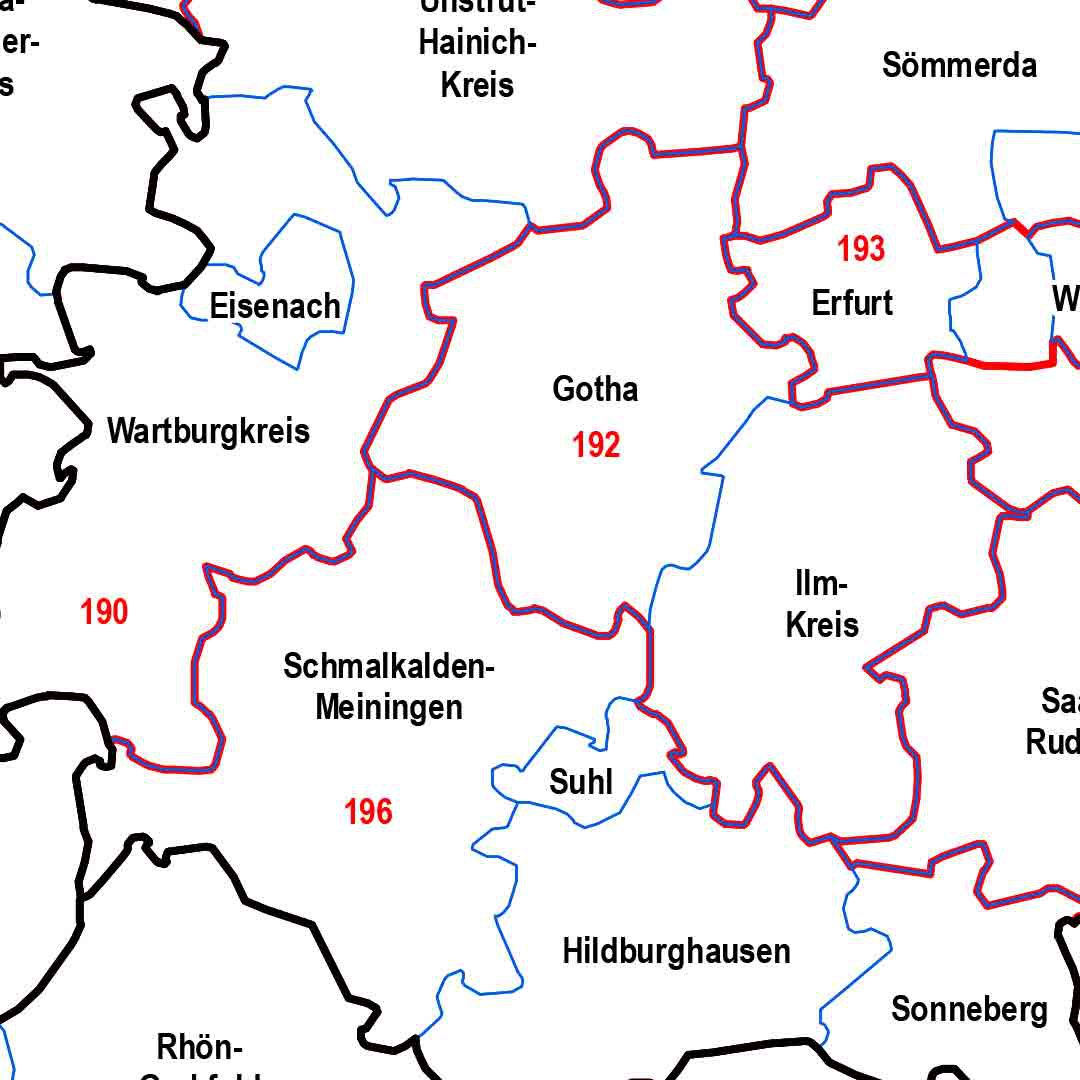
Kliknij link z geo-kodami ID Niemiec powyżej, który przeniesie Cię na stronę z mapą ze strukturą administracyjną Niemiec.
Przybliż mapę, aby wyświetlić kod każdego landu.France Geo ID dataset by Geonames
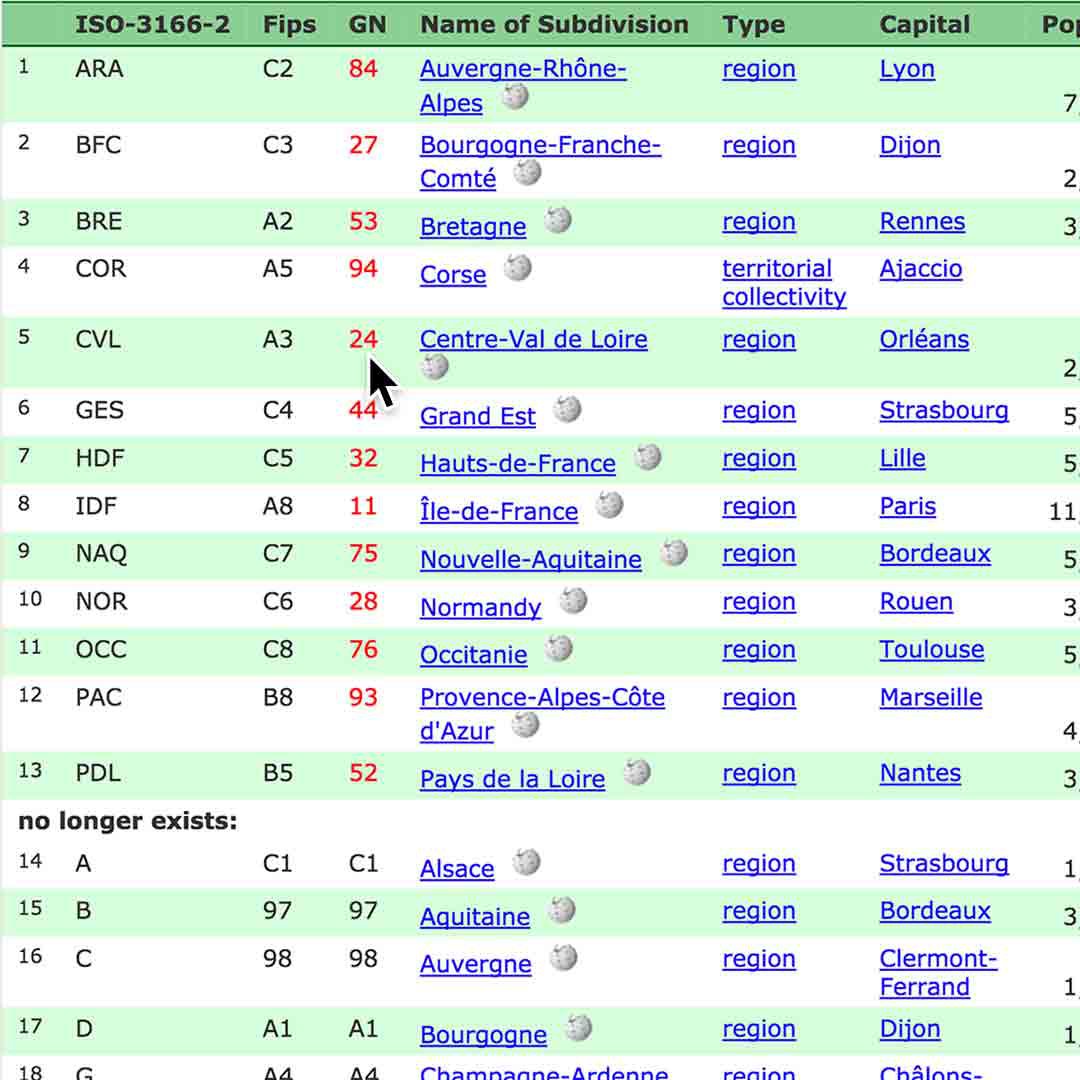
Kliknij powyższy link z geo-kodami ID Francji, aby wyświetlić kody regionów w kolumnie o nazwie GN.
Formatowanie niestandardowego pliku CSV.
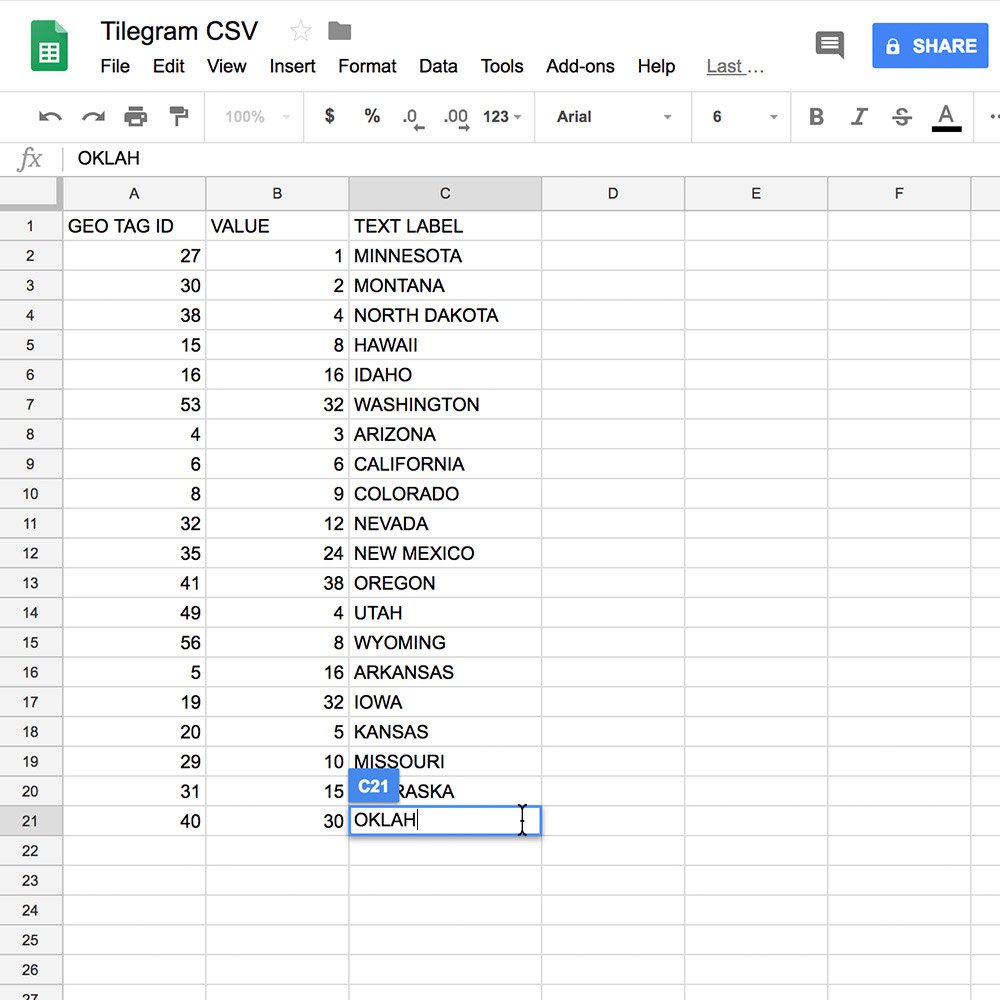
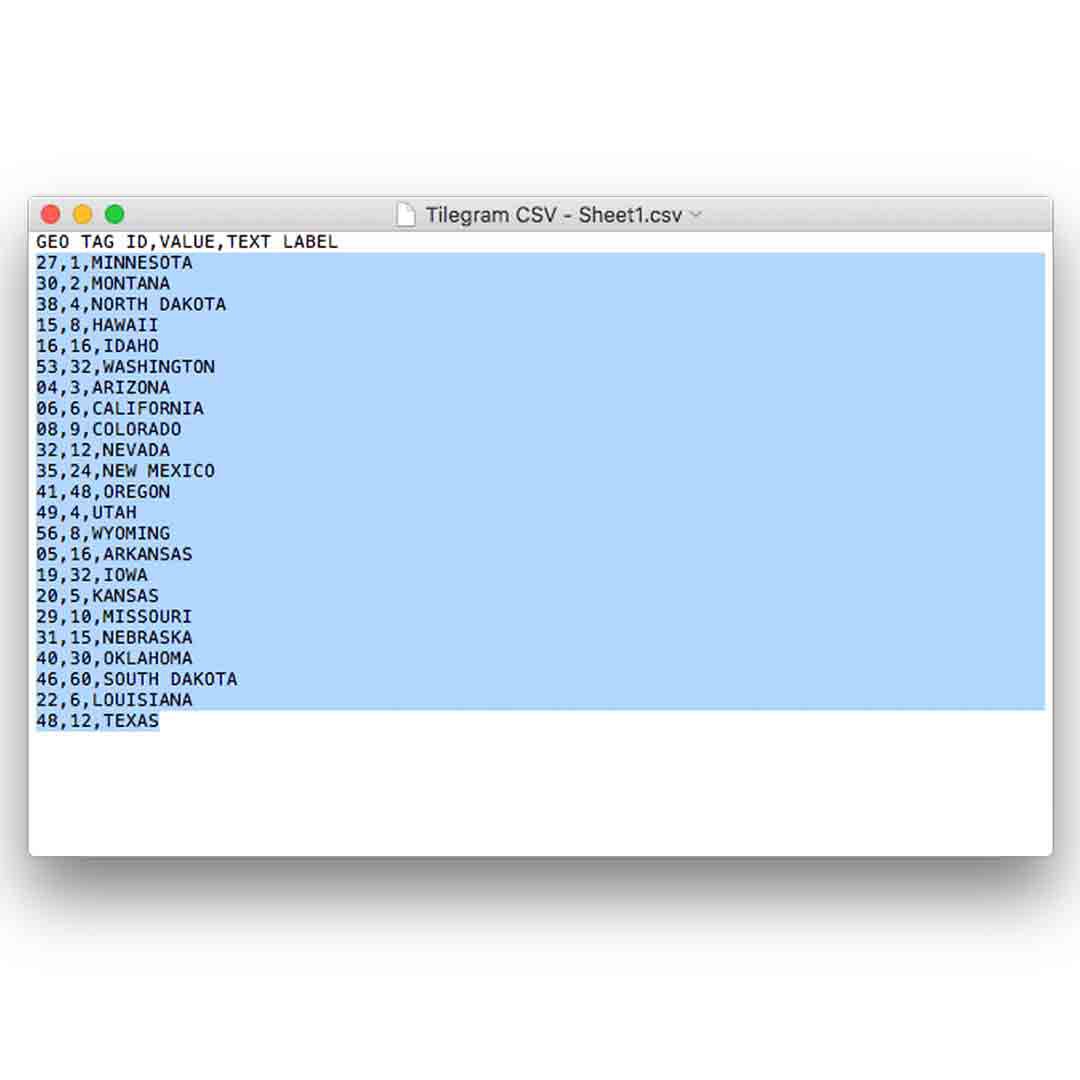
Otwórz edytora arkuszy kalkulacyjnych. Aby utworzyć własny plik danych CSV (Comma Separated Values), użyj modelu z trzema kolumnami. Kolumna 1: Geo-kod ID dla danego obszaru. Oprogramowanie wie, „gdzie” szukać danego miejsca. Kolumna 2: Wartość, jaką chcesz przypisać. Informacja dla oprogramowania: „ile”. Na przykład populacja, PKB itd. Kolumna 3: Nazwa w postaci tekstu opisująca dane terytorium, na przykład „Kalifornia”, „Nowy Jork”. W żaden sposób nie wpływa ona na kształt kartogramu.
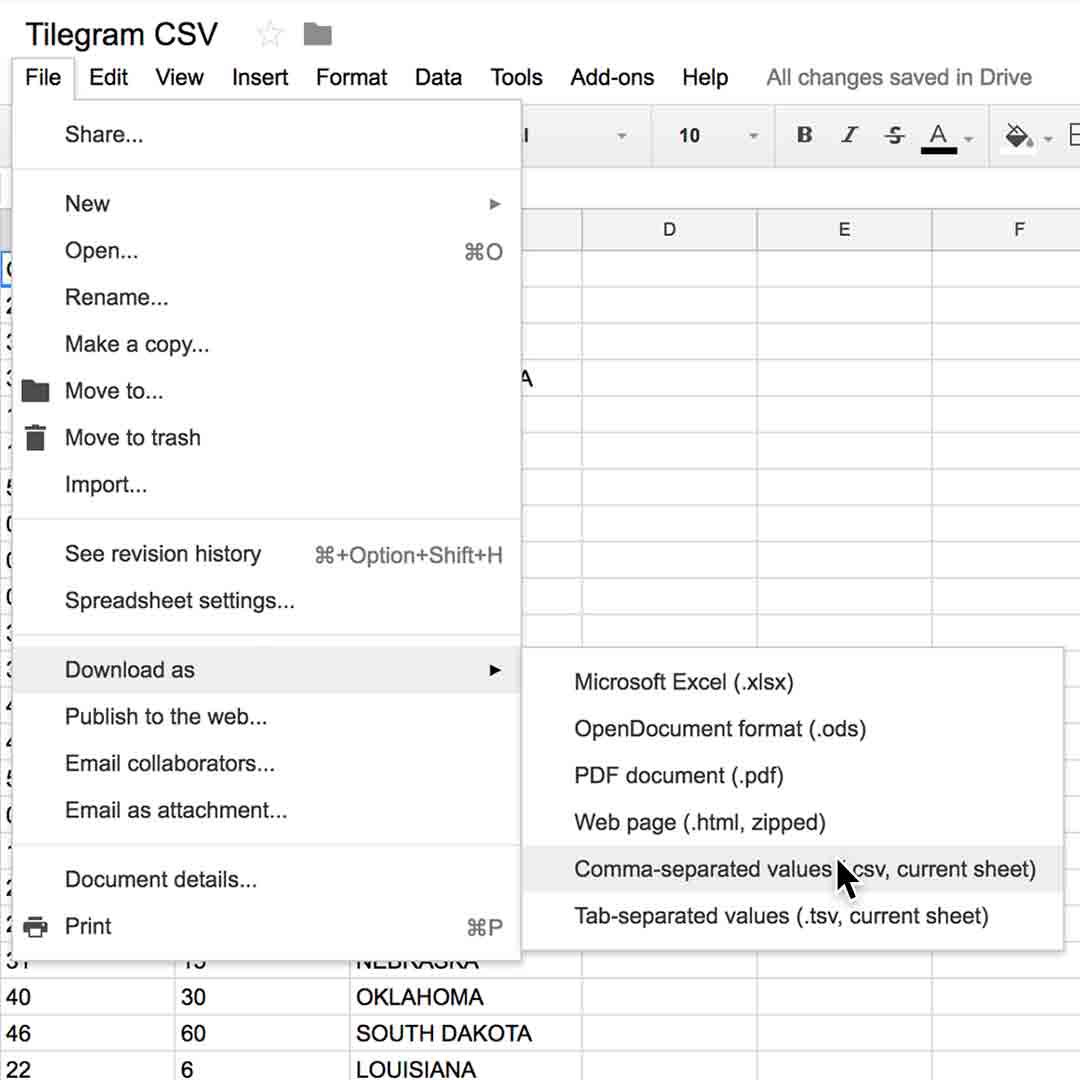
Gdy masz już kompletne dane, kliknij Plik, następnie Pobierz jako i CSV.
Tworzenie własnego kartogramu anamorficznego.
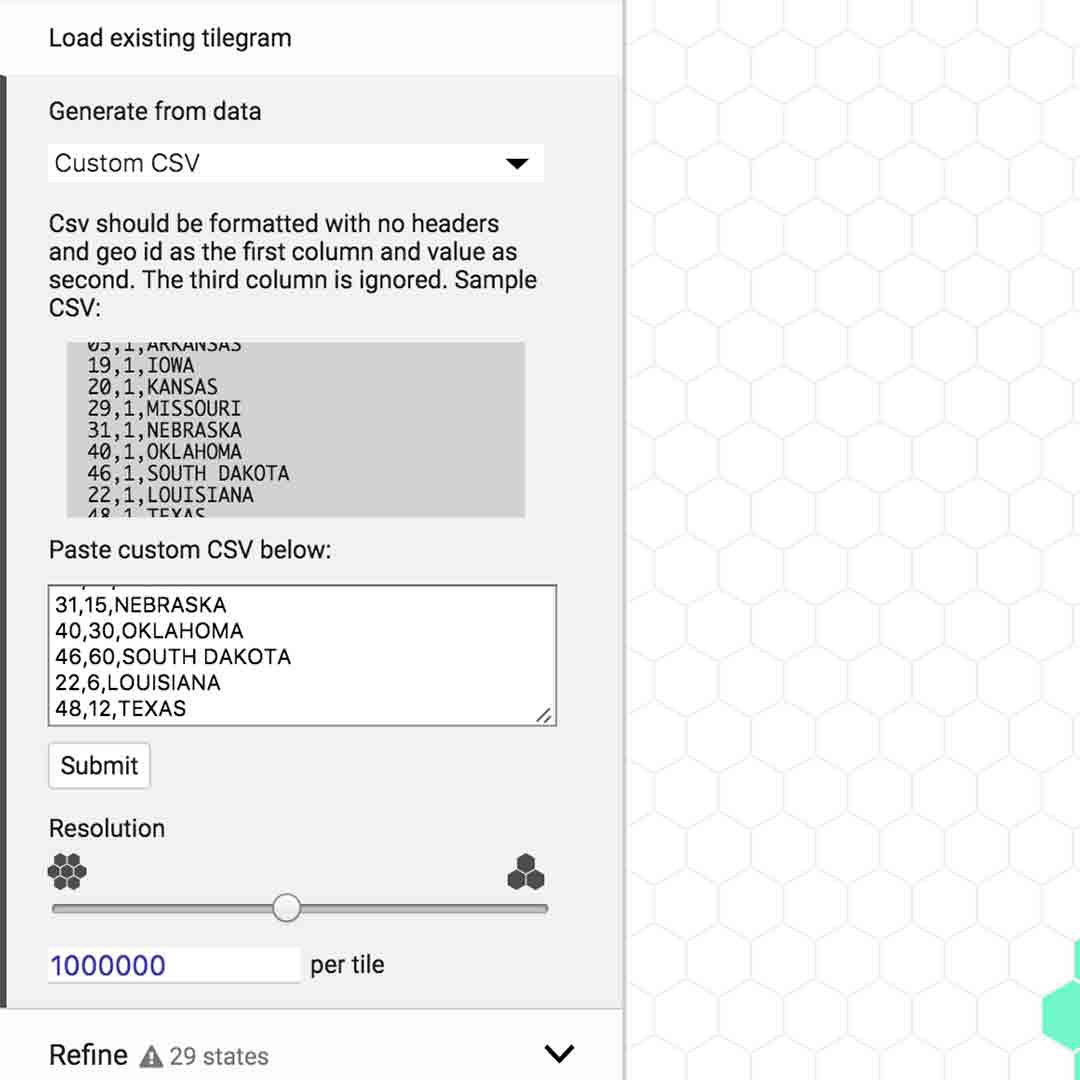
Gdy Twoje źródło danych jest prawidłowo sformatowane i gotowe, wybierz Wszystkie i Kopiuj.
Wklej wartości do okna o nazwie Wklej niestandardowy plik CSV poniżej.
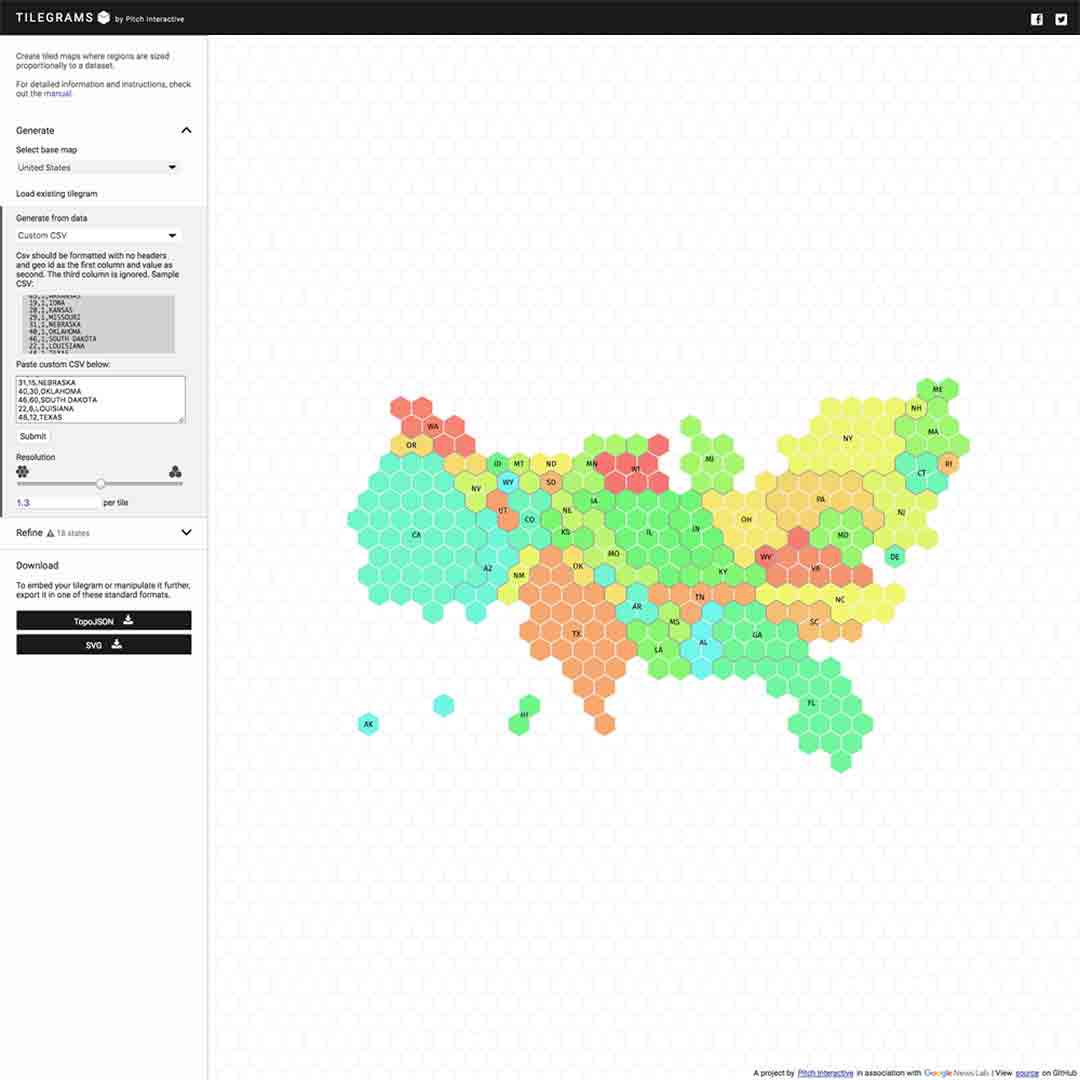
Generowanie Twojego kartogramu powinno zacząć się automatycznie w oknie po prawej stronie.
Dostosowywanie i pobieranie.
Teraz możesz powtórzyć te same kroki, co w przypadku istniejącego kartogramu.
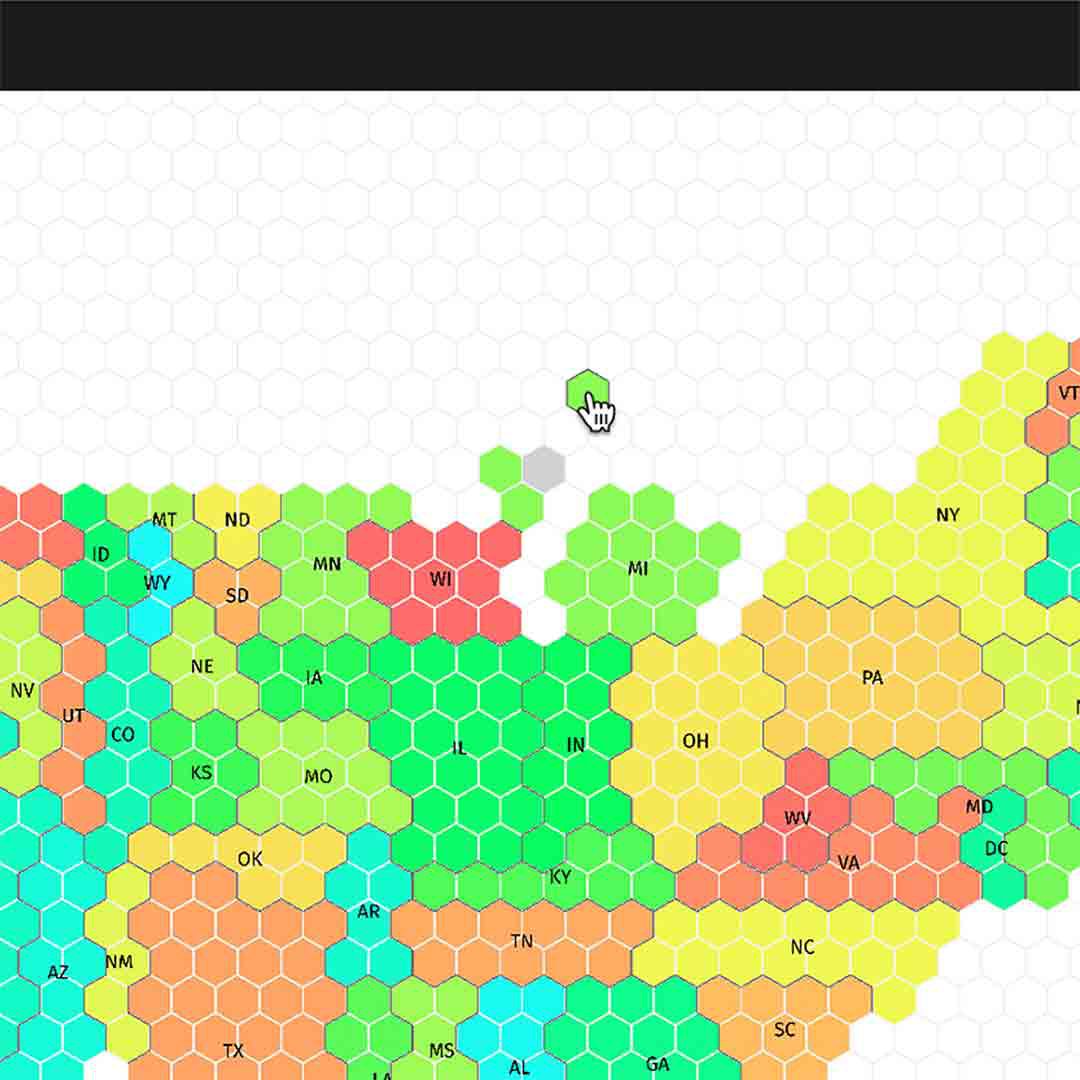
Przeciągnij „kafelki”.
Dostosuj rozdzielczość i znajdź właściwą równowagę tak, aby informacje były statystycznie dokładne i rozpoznawalne geograficznie. Szczegółowe informacje na temat tego, jak powstał Tilegrams znajdziesz w poście Pitch Interactive’s blog post.
-
![GoogleEarthTimelapse_ObservingChange]()
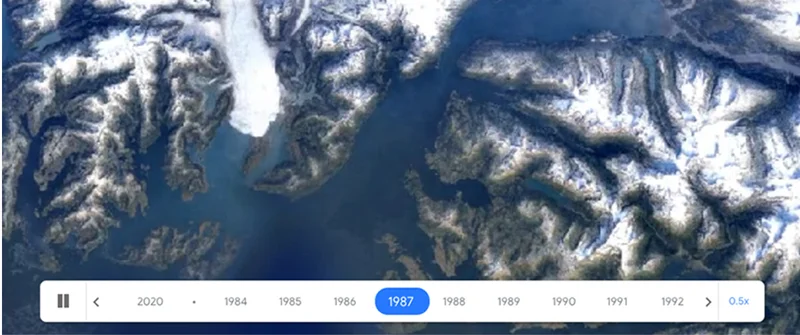
Google Earth Timelapse: Obserwowanie zmian
LekcjaZobacz, jak zmieniała się Ziemia przez ostatnie 35 lat. -
![gni_business_lesson_play_1]()
Stwórz strategię pozyskiwania funduszy
LekcjaWybierz odpowiednie źródła finansowania swojego dziennikarstwa -
![YouTube Thumbnails (20)]()
Film: Google Earth i technologie mapowania dla reporterów
LekcjaZobacz, do czego dziennikarze mogą wykorzystać Google Earth i technologie mapowania