5 分 で完了
Google の分析ツールを活用して読者を増やす

読者データに基づいて、より的確に意思決定する
Google の分析ツールとは

読者についてどれだけ知っているか
調査によると、読者データを使用し、読者を理解しているニュース メディアは、理解していないニュース メディアに比べて、以下のような優れた成果を上げています。
- 読者収益が 20% 多い
- デジタル広告を 20% 高い価格で販売している
- 記事のクリック数が 40% 多い
Google のツールは読者の獲得にどう役立つのか
- Google アナリティクス
- News Consumer Insights
- Realtime Content Insights
- Google Looker Studio
News Consumer Insights、Realtime Content Insights、Google Looker Studio を使用するには Google アナリティクス アカウントが必要です。
News Consumer Insights のデータに基づいて意思決定する
どうすればより多くの読者の興味を引いたり、ニュースサイトの滞在時間を長くしたりできるか
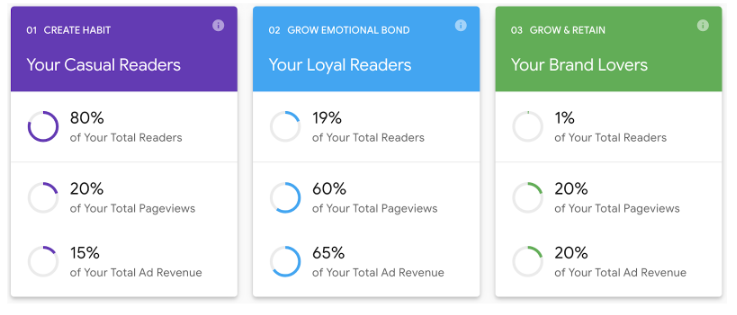
News Consumer Insights では、エンゲージメントに基づいて以下のように分類された読者別に、自社サイトの Google アナリティクスデータの結果を確認して、さらなる読者の獲得に役立てることができます。
- カジュアル ユーザー
- ロイヤル ユーザー
- ブランド愛好ユーザー
News Consumer Insights は、読者 データに基づいてエンゲージメントを高める方法を提案してくれるため、収益の向上につながります。
Realtime Content Insights でパフォーマンスが上位の記事を見つける
読者はどのようなニュースに関心を持っているか
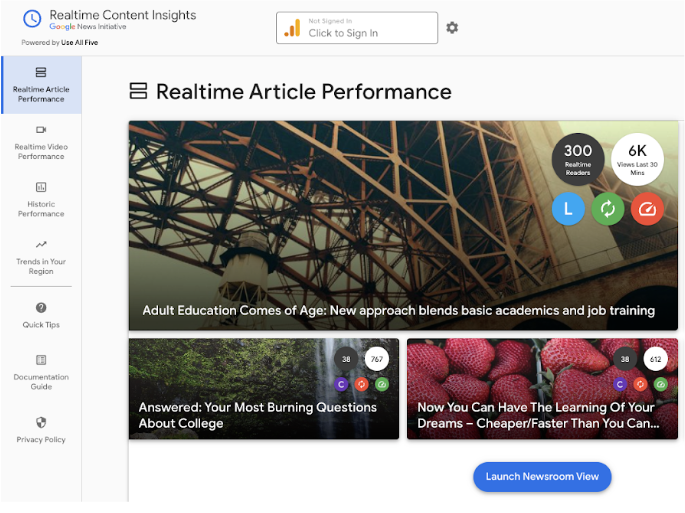
Realtime Content Insights は、ニュース メディアの Google アナリティクス データを分析して、以下のデータを提供します。
- リアルタイムと過去の上位記事
- 最も熱心な読者が閲覧した記事
- その地域の Google と YouTube の検索トレンド
Google Looker Studio でデータを可視化する
どうすればデータをさらに活用できるか
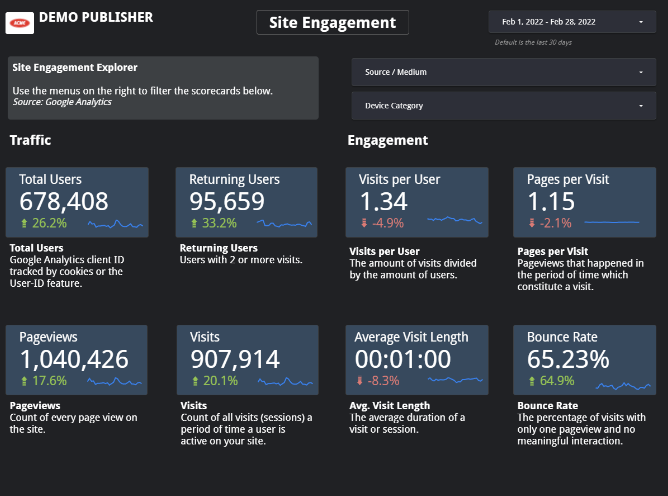
Google Looker Studio を使用すると、以下のことが可能になります。
- Google アナリティクスや Google 広告などの Google サービスからデータを収集する
- データを可視化してひと目でわかるようにする
- 自動生成されるレポートを使って、常に最新情報をチームと共有する
このレッスンに対する評価をお聞かせください。
お寄せいただいたフィードバックは、レッスンの継続的な改善に役立てさせていただきます。
はい、取り組んでいます
あなたへのおすすめ