Data Source: Global Forest Watch.
Deforestation data and monitoring tools.
What is Global Forest Watch?
Global Forest Watch (GFW) is a remarkable collaboration of the World Resources Institute, Google, the Jane Goodall Institute and other partners that provides data and tools to help journalists, governments and researchers understand harmful forest loss and its effect on climate change.
In the past, people have struggled to understand when and where forests are cleared, why it happens, and who is responsible. Using satellite data and cloud computing, GFW monitors the world’s forests in near real time—delivering data about deforestation, fires, climate and commodities that would have formerly taken years to gather and process.
Reporting on climate change.
The GFW platform will help you report on climate change by providing timely, in-depth information on carbon emissions from tropical deforestation. You can explore landscapes and analyse carbon data on our interactive map, as well as customise reports to show only the data you want to see and share it with your story.
Several tools also help you monitor change over time and compare countries, jurisdictions and areas of interest. You can even monitor deforestation in conjunction with carbon emissions, as well as looking at data for canopy density, carbon stores in trees and carbon stores in soil.
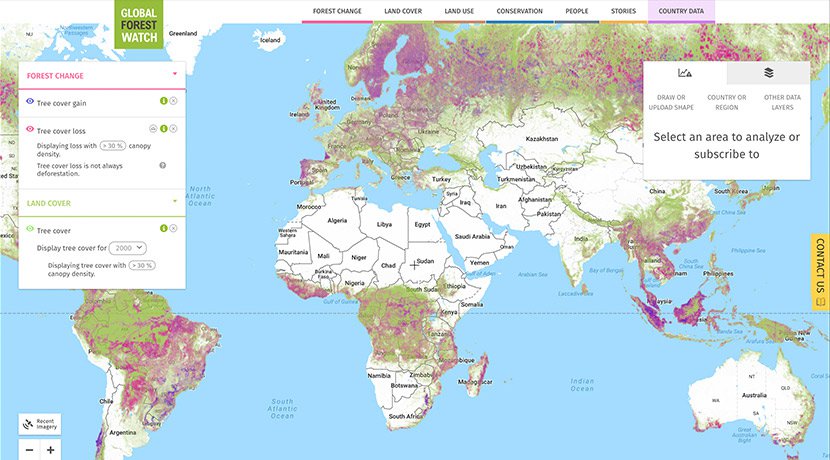
Interactive map of forest change.
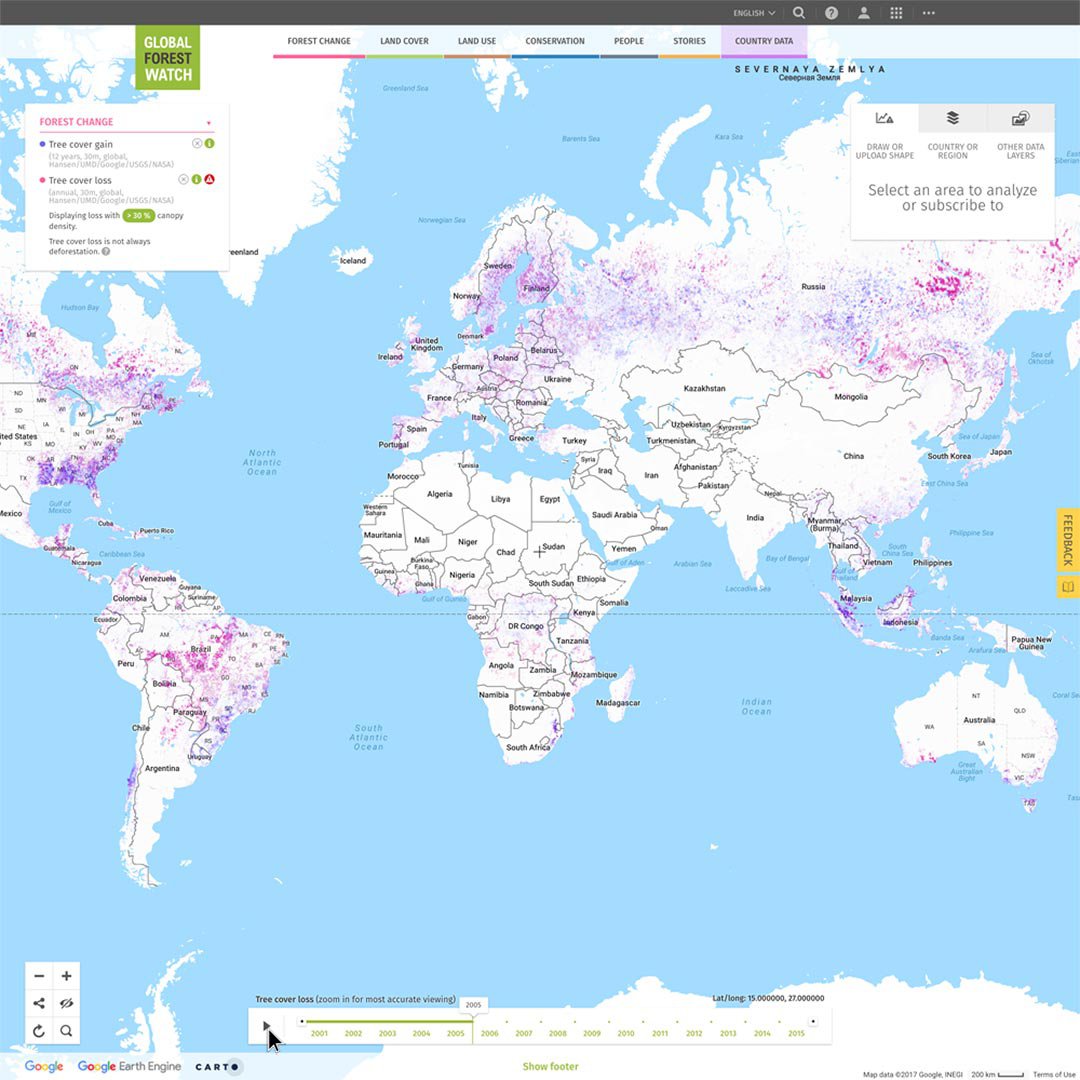
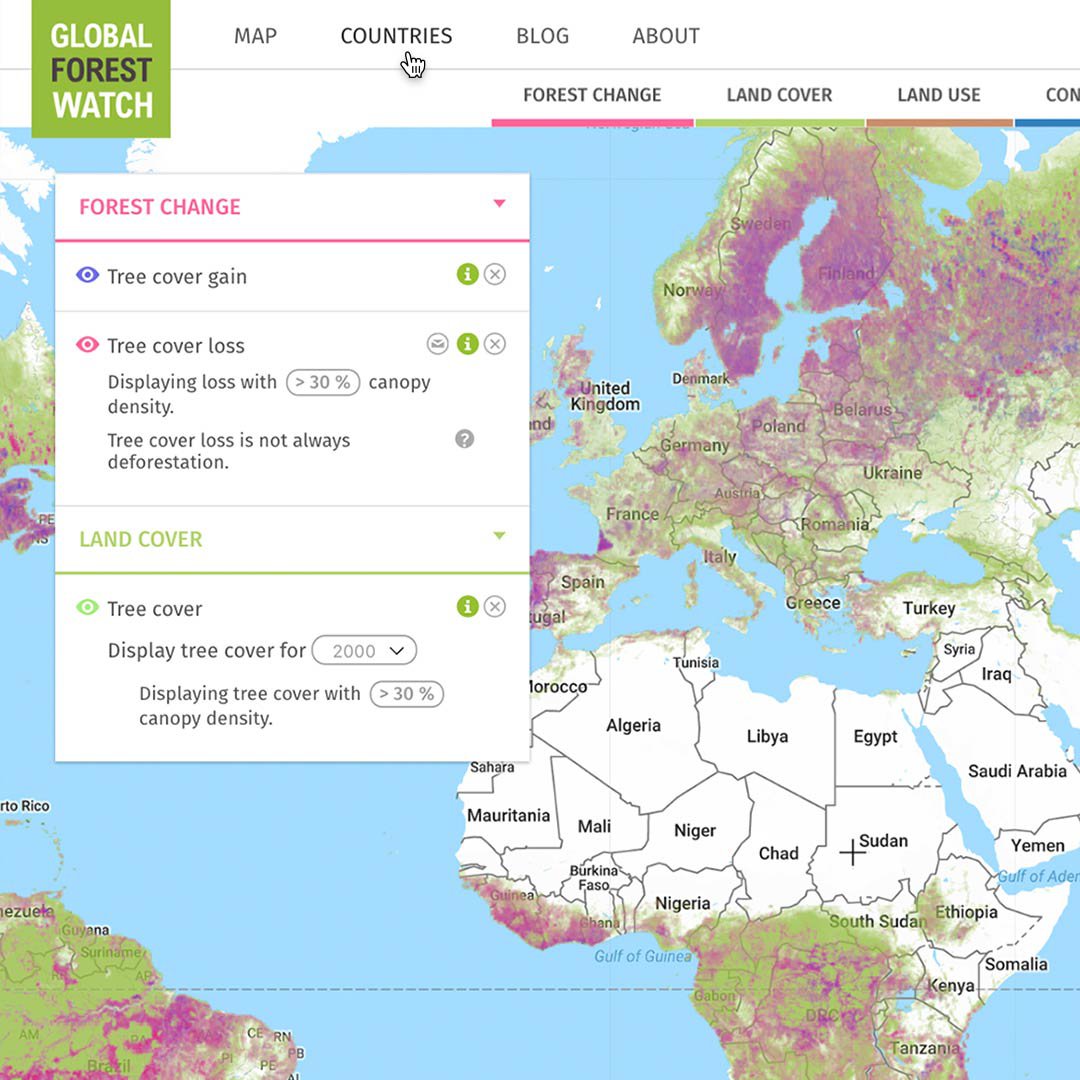
The central tool of GFW is an interactive map depicting the world’s forest change (tree cover and loss) powered by data sets that stretch from 2000 to 2015.
To explore the interactive map, first go to globalforestwatch.org. Then, Map.
Use the map to explore forests around the world.
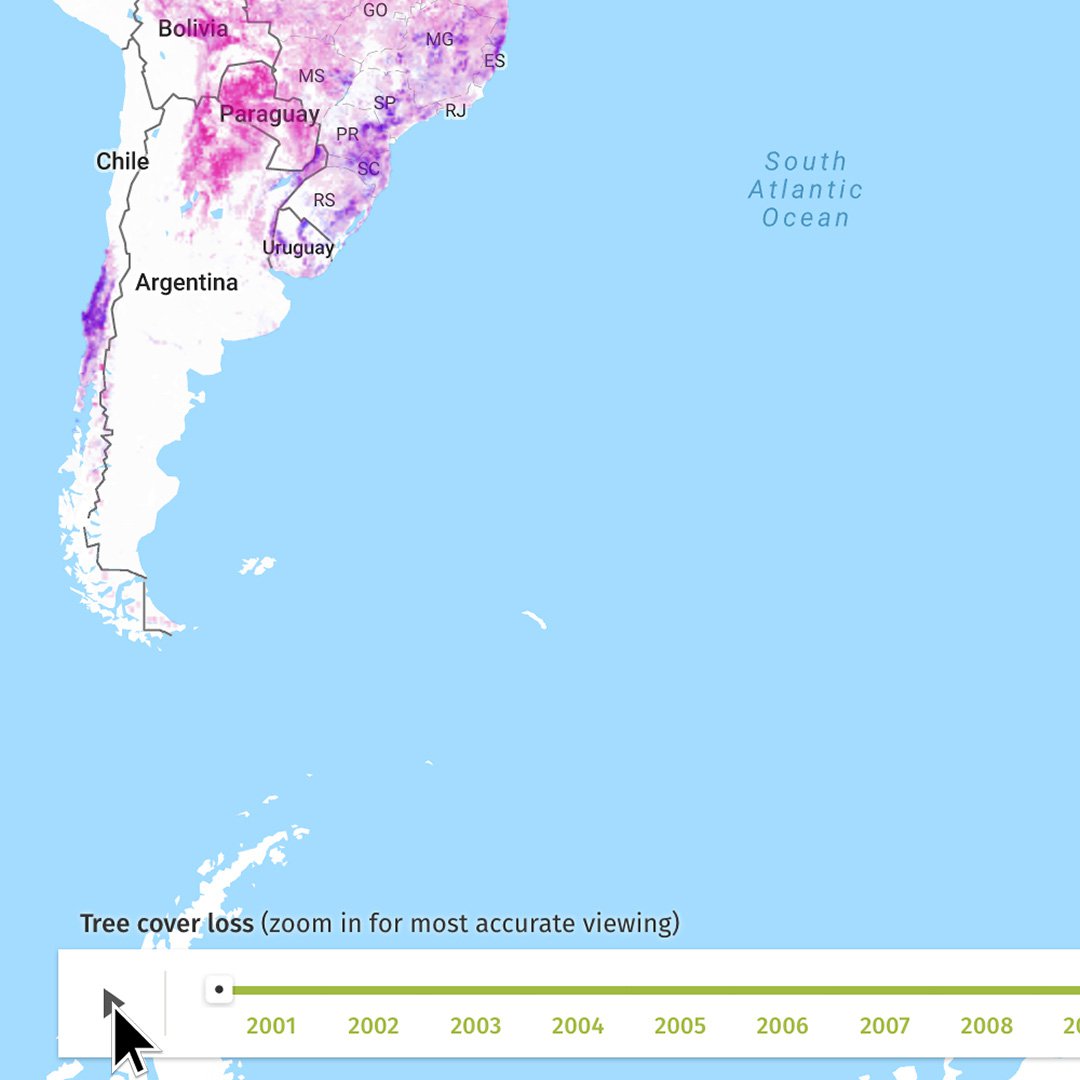
To focus on subsets of time, use the slider at the bottom of the map.
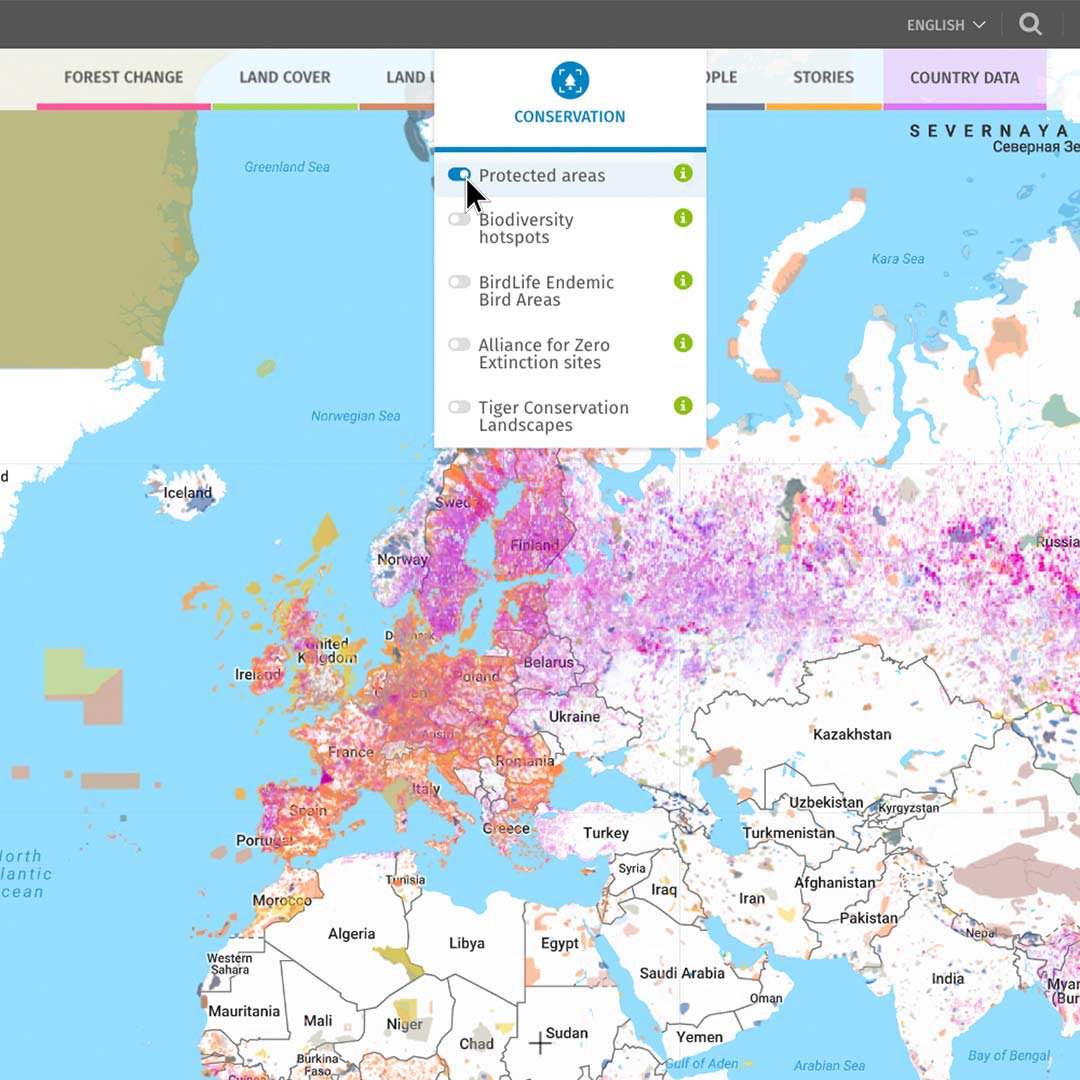
Turn specialty layers on or off to show factors such as conservation areas, land use, and intact forest landscapes.
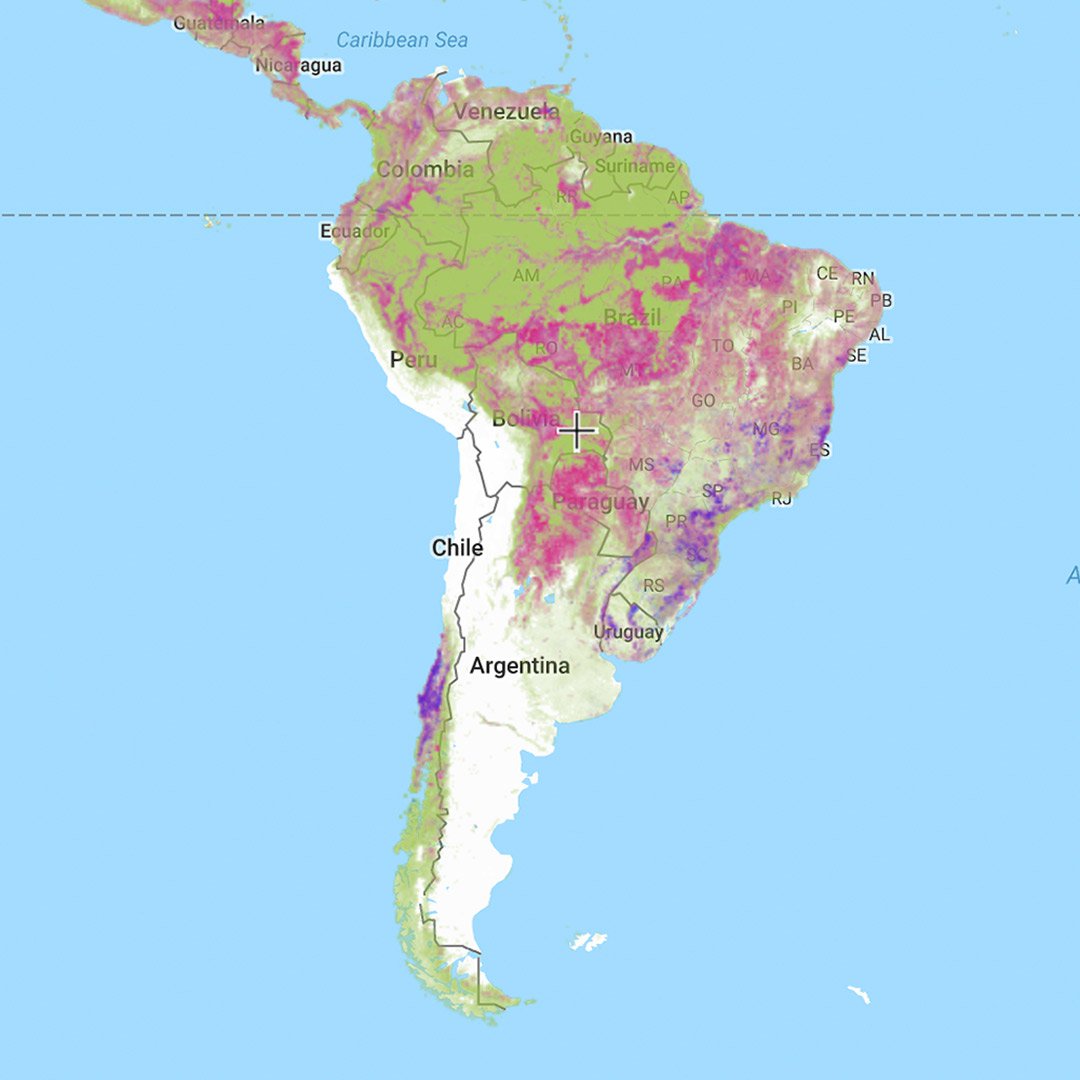
Customise your interactive map.
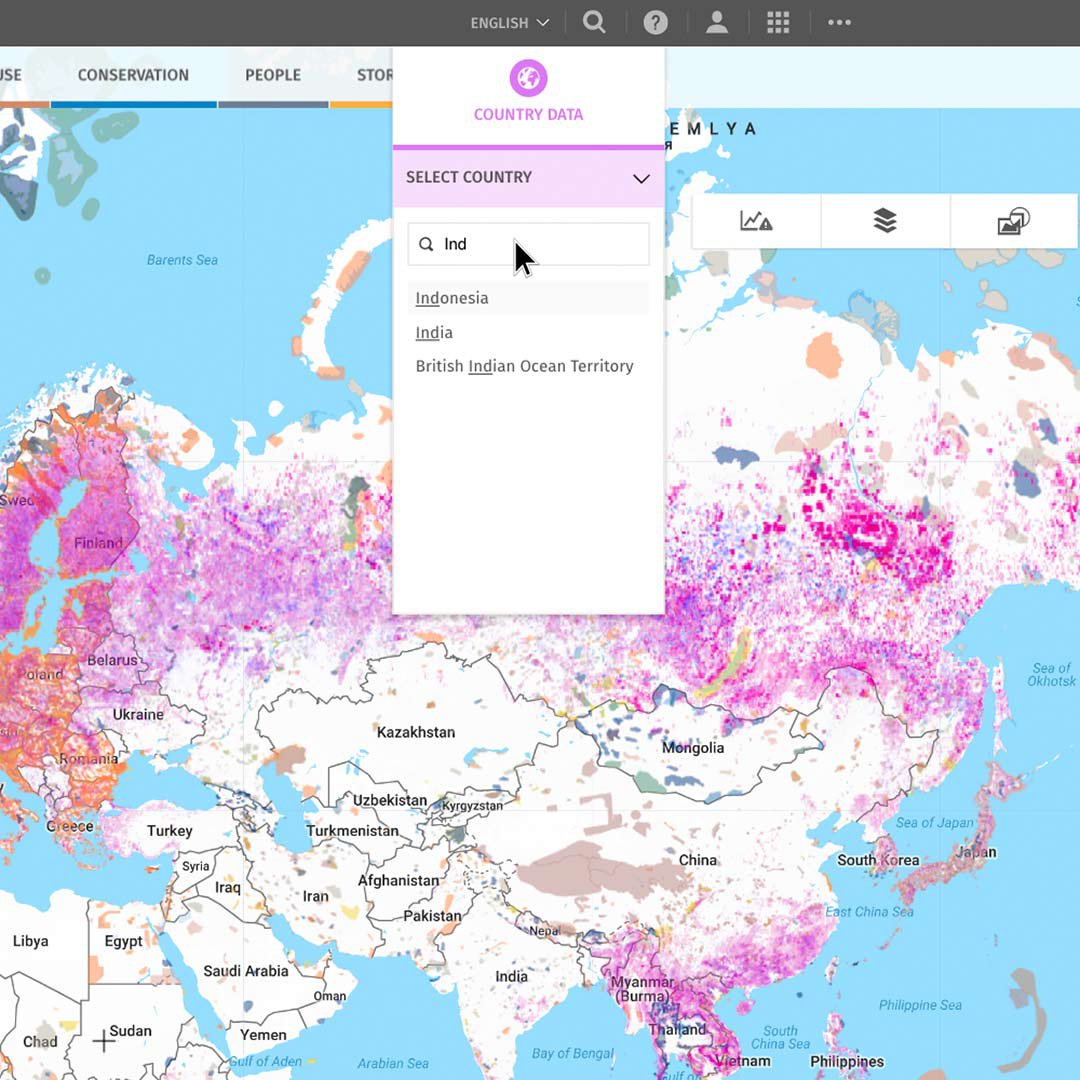
The interactive map also allows you to get more granular views of impacts in specific regions you may be covering and to modify the look of the map per your needs.
Customise your map view by clicking Country Data and selecting a country or region or drawing your own area to analyse.
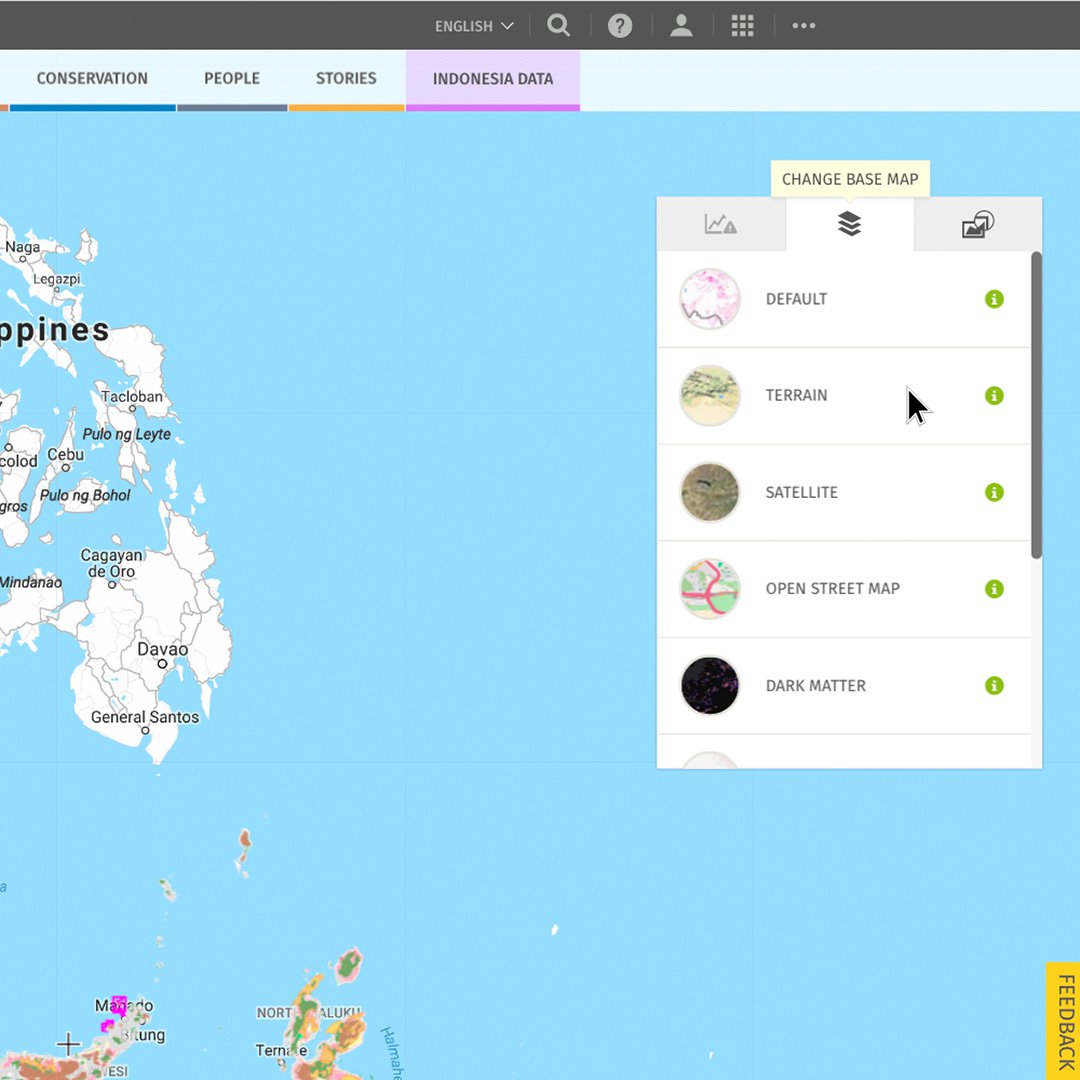
Choose from a variety of base map options such as satellite, terrain or road maps.
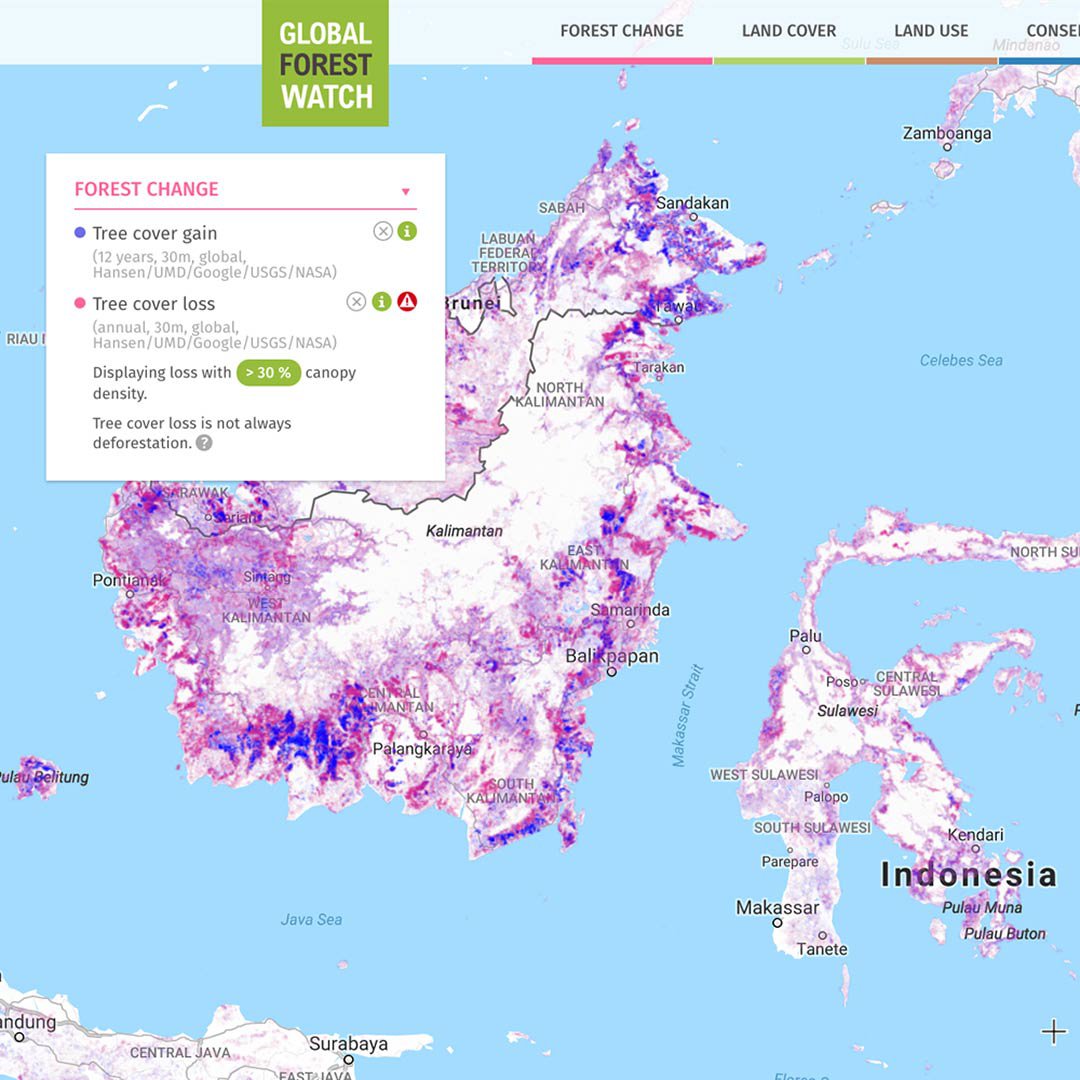
Country profiles.
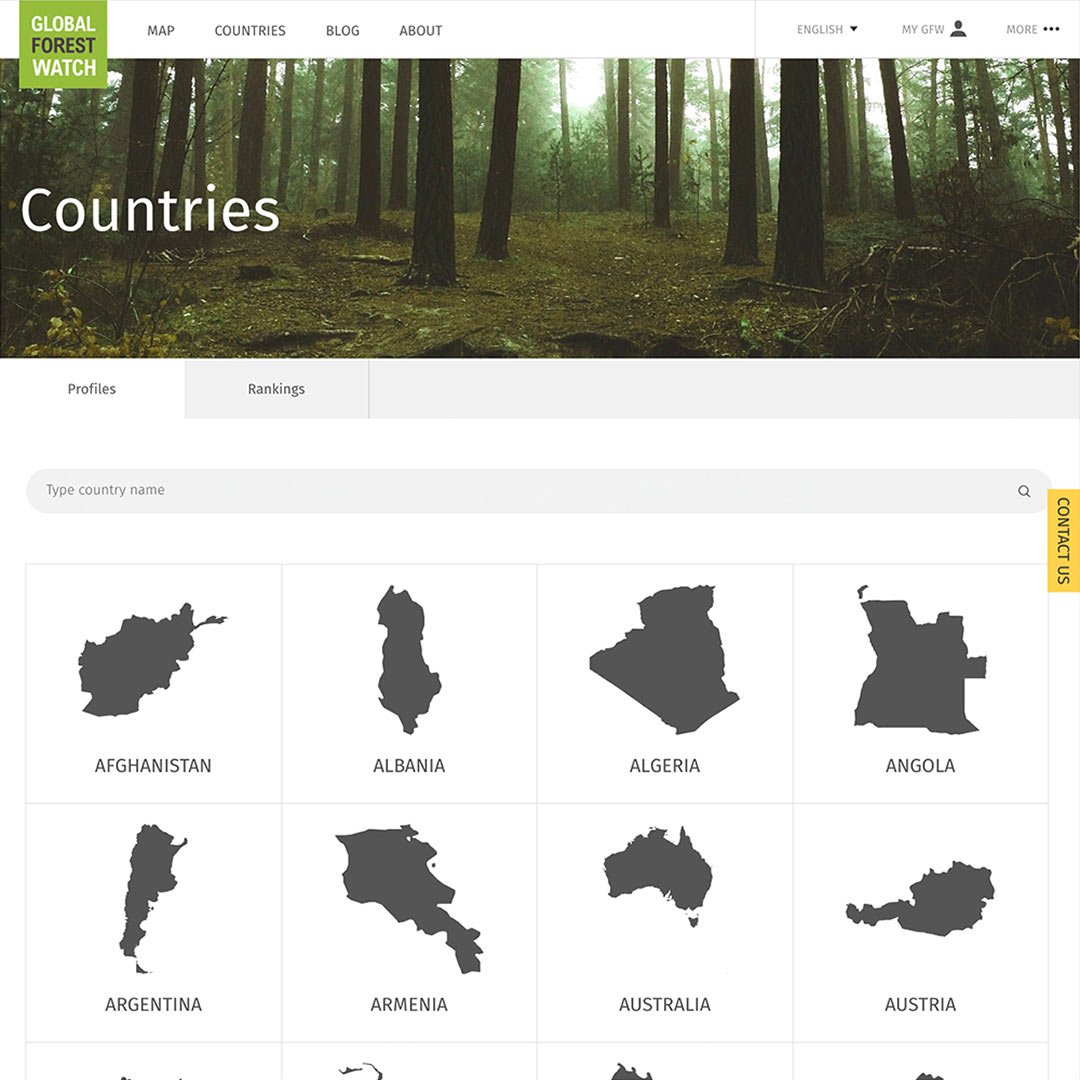
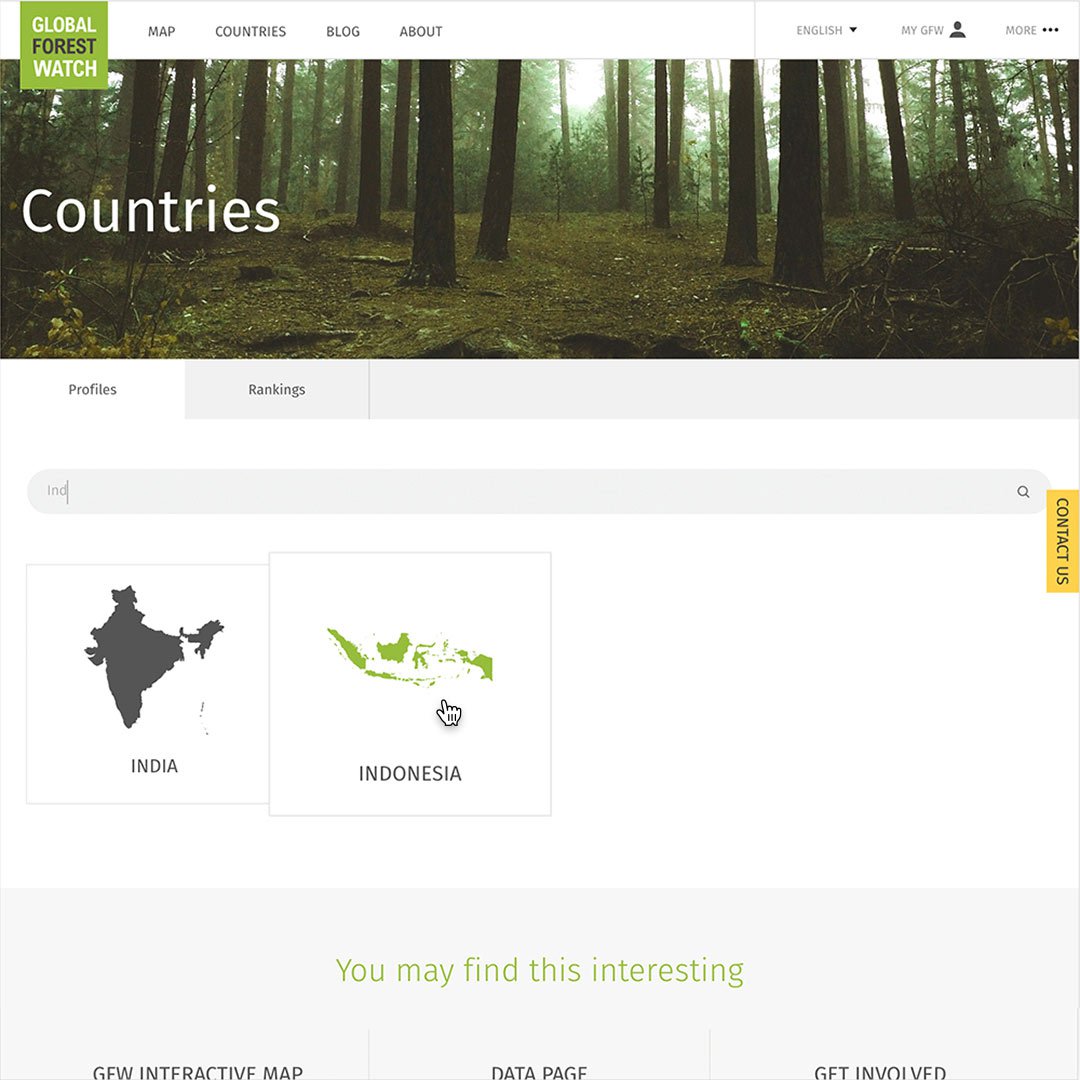
If you know what country you want to research, you can go straight to its profile. GFW carries data on 204 countries.
Roll over the navigation bar to reveal the top nav. Then click Countries.
Choose from the 167 countries.
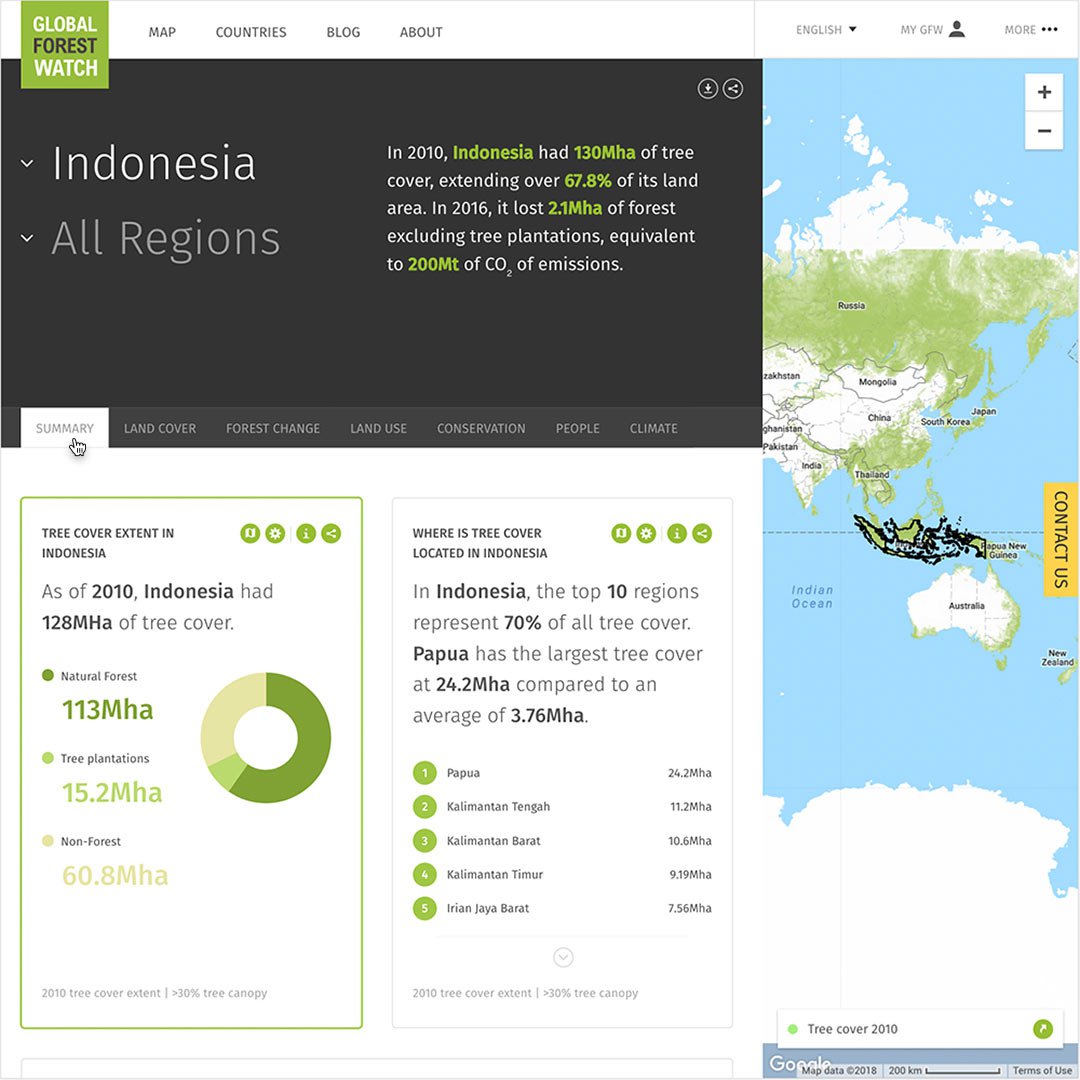
Using Indonesia as an example, you can see a remarkable amount of data.
Click through the tabs to reveal statistics on land cover, forest loss and management, economic impact and employment related to forests, governmental management, reforestation, CO2 emissions, carbon stocks and international agreements.
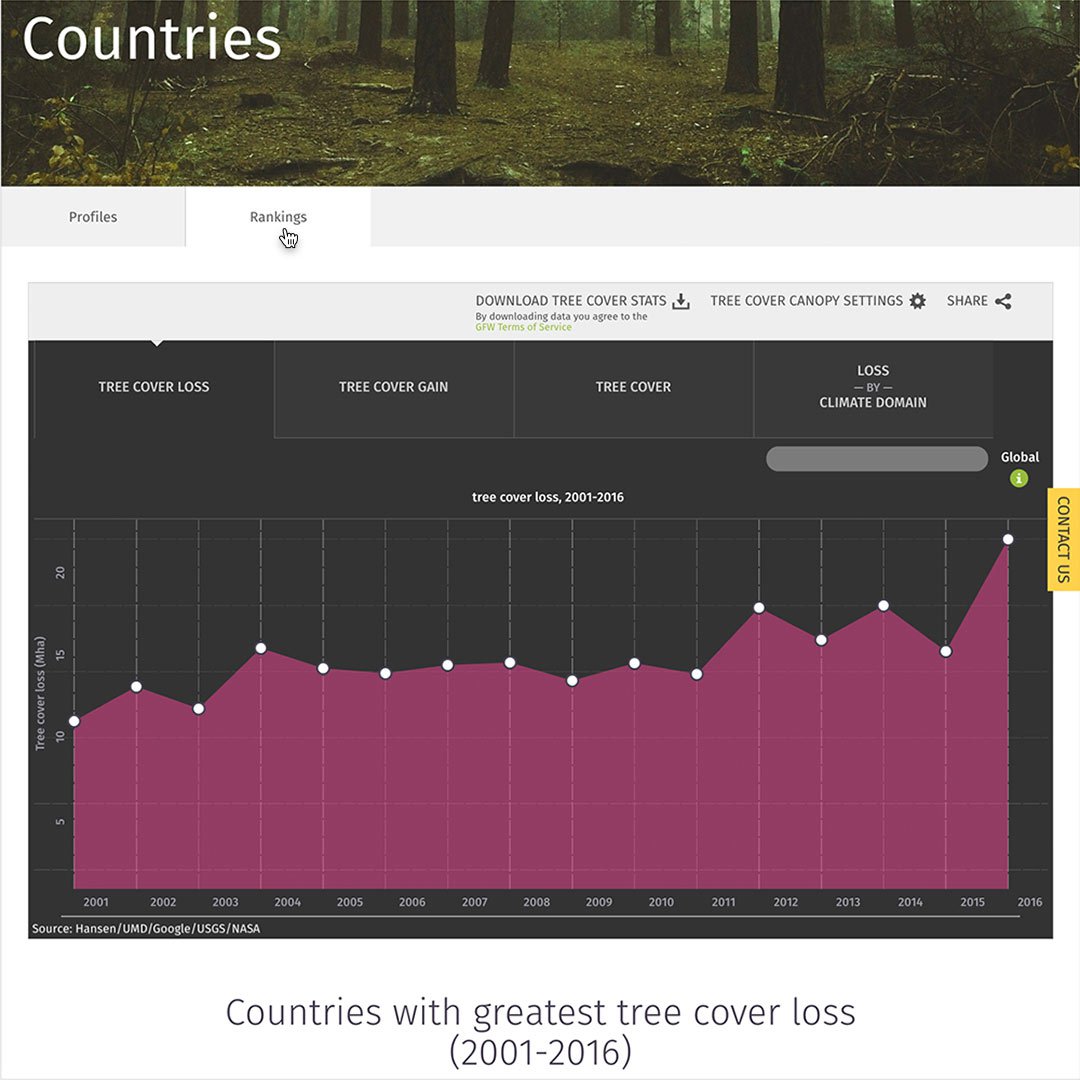
You can also see a country’s forest profile in context with other countries by choosing Rankings. This shows the countries with greatest tree cover loss at the top: Russia, Brazil and Canada.
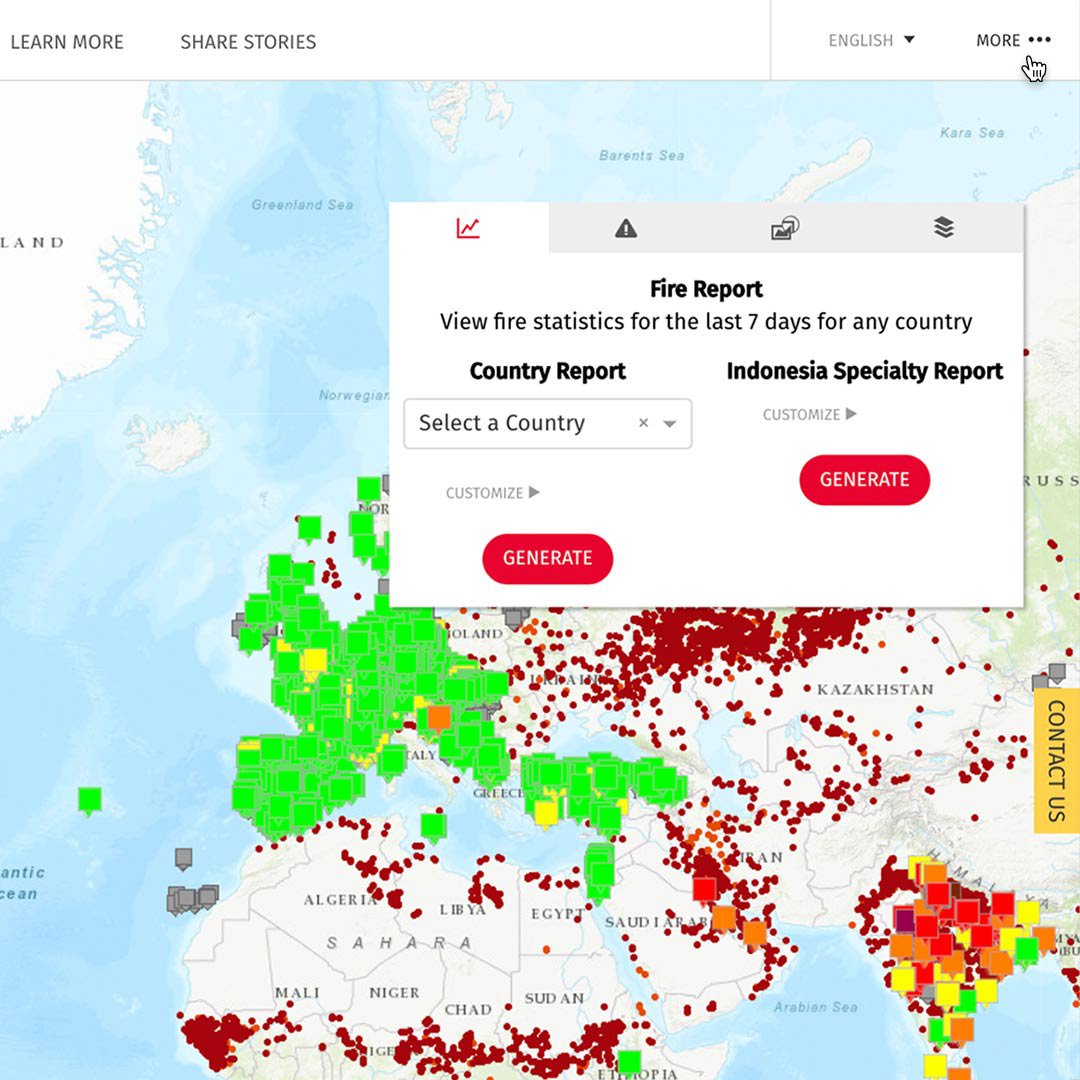
Monitoring fires on GFW.
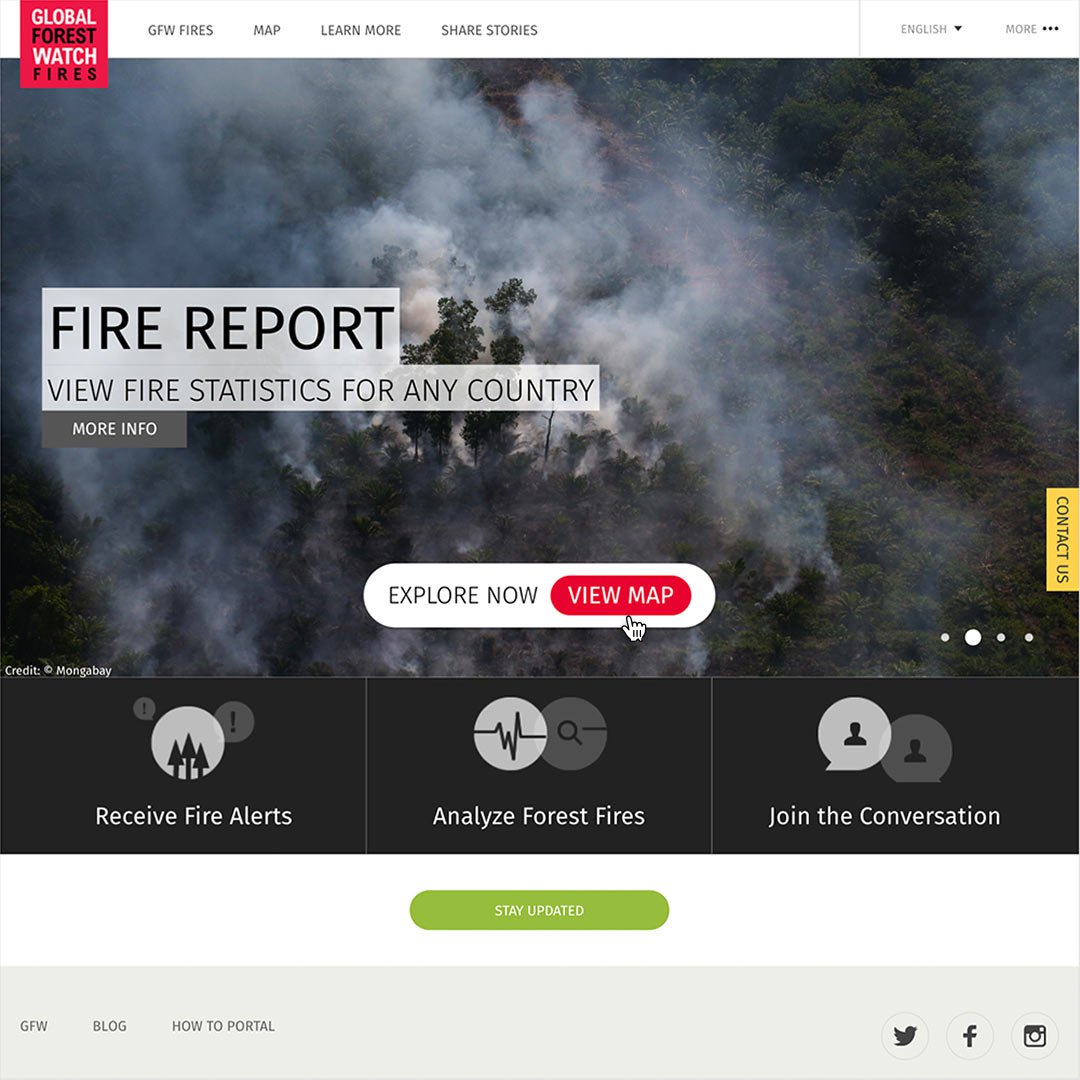
GFW Fires is a tool to monitor emerging fires, identify potential causes, and analyse impacts of fires on forests and people.
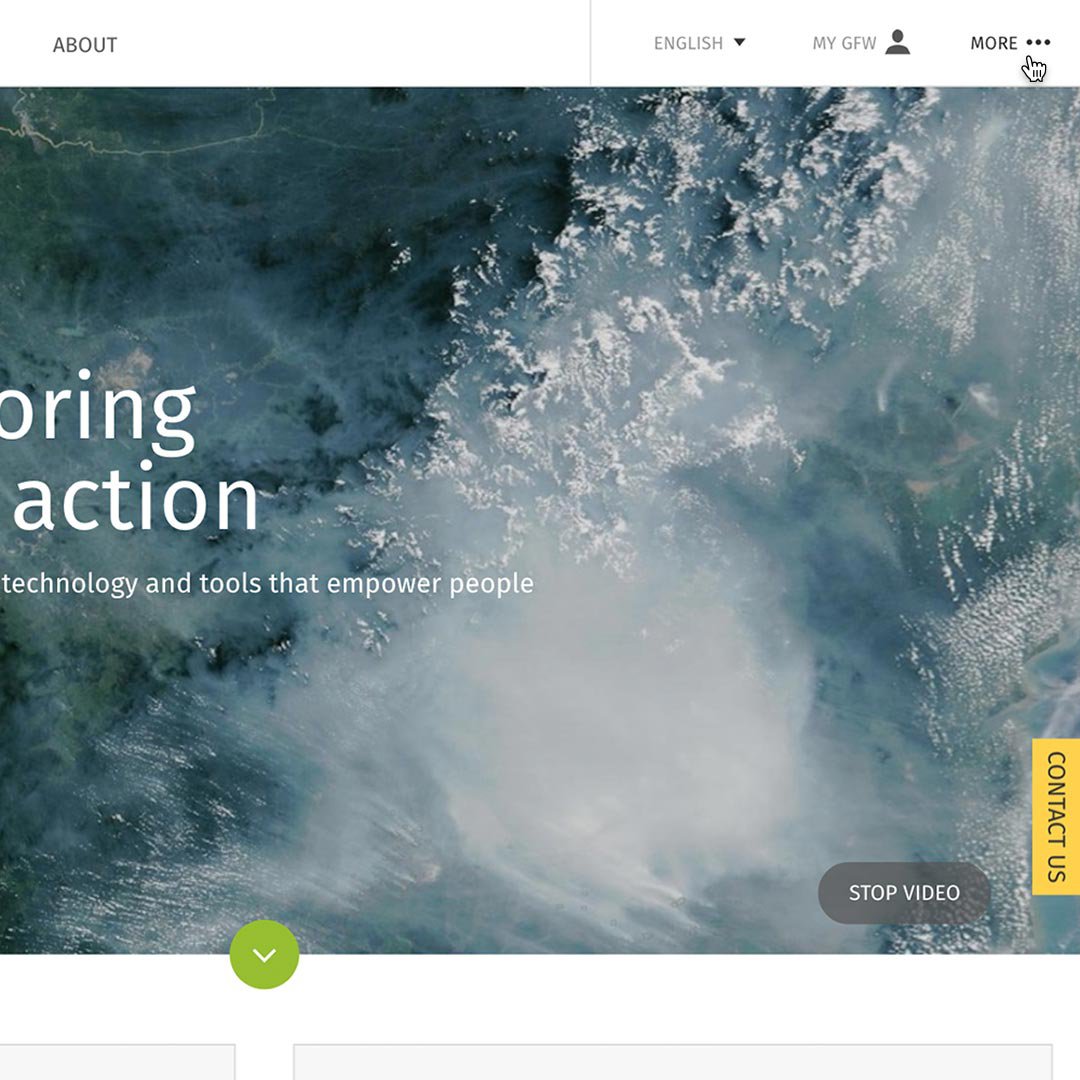
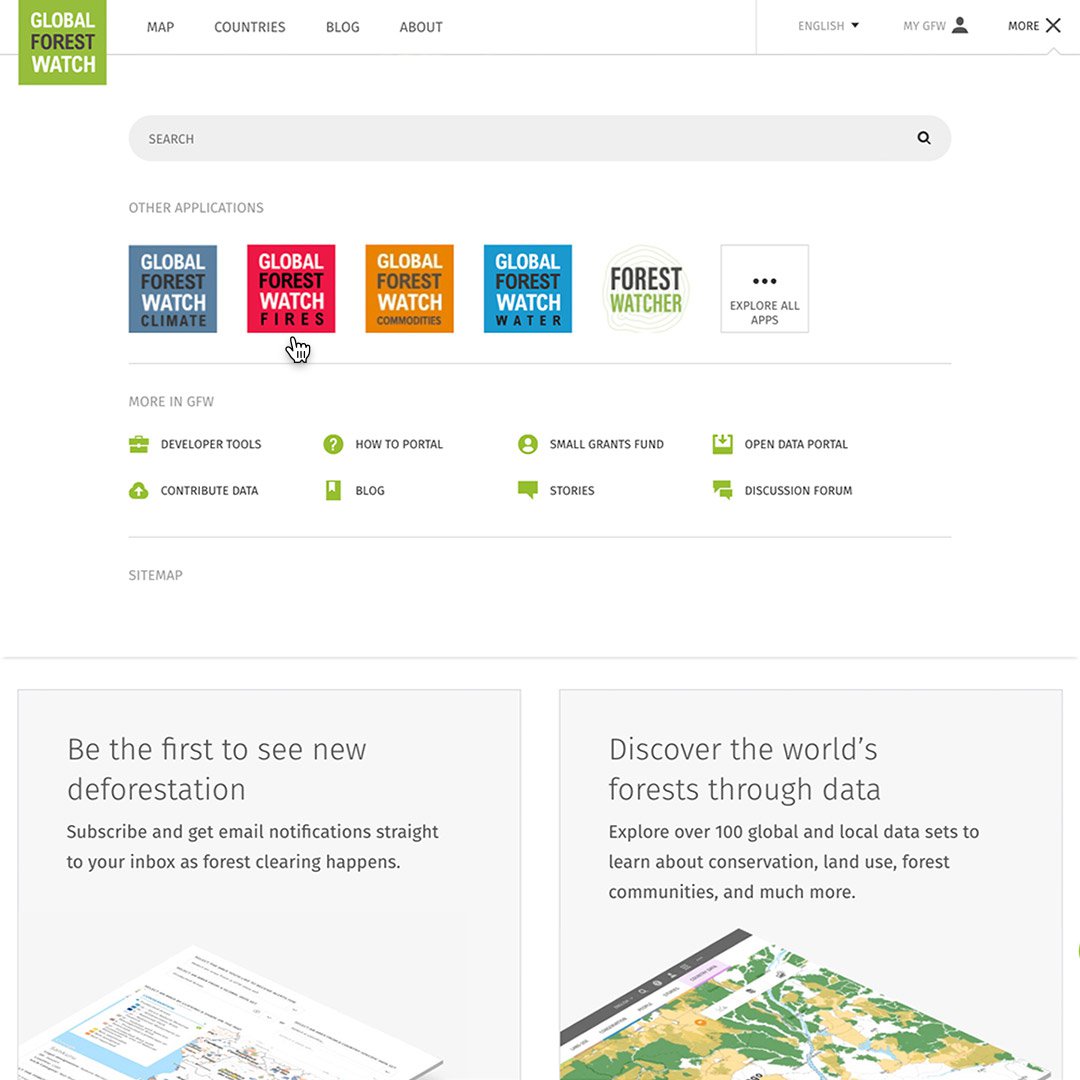
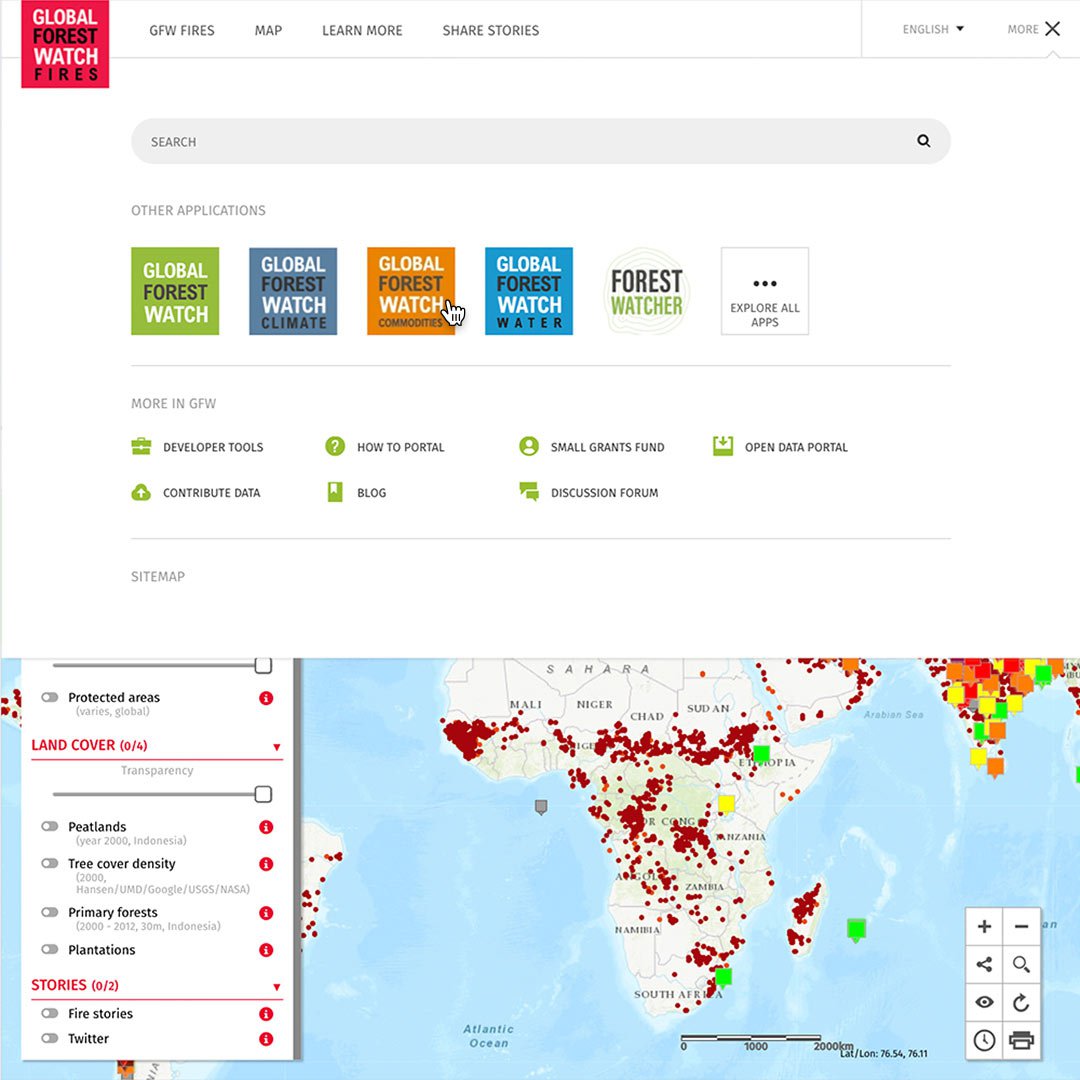
From any page, you can click More to access additional GFW apps.
Select Global Forest Watch Fires.
Click View Map.
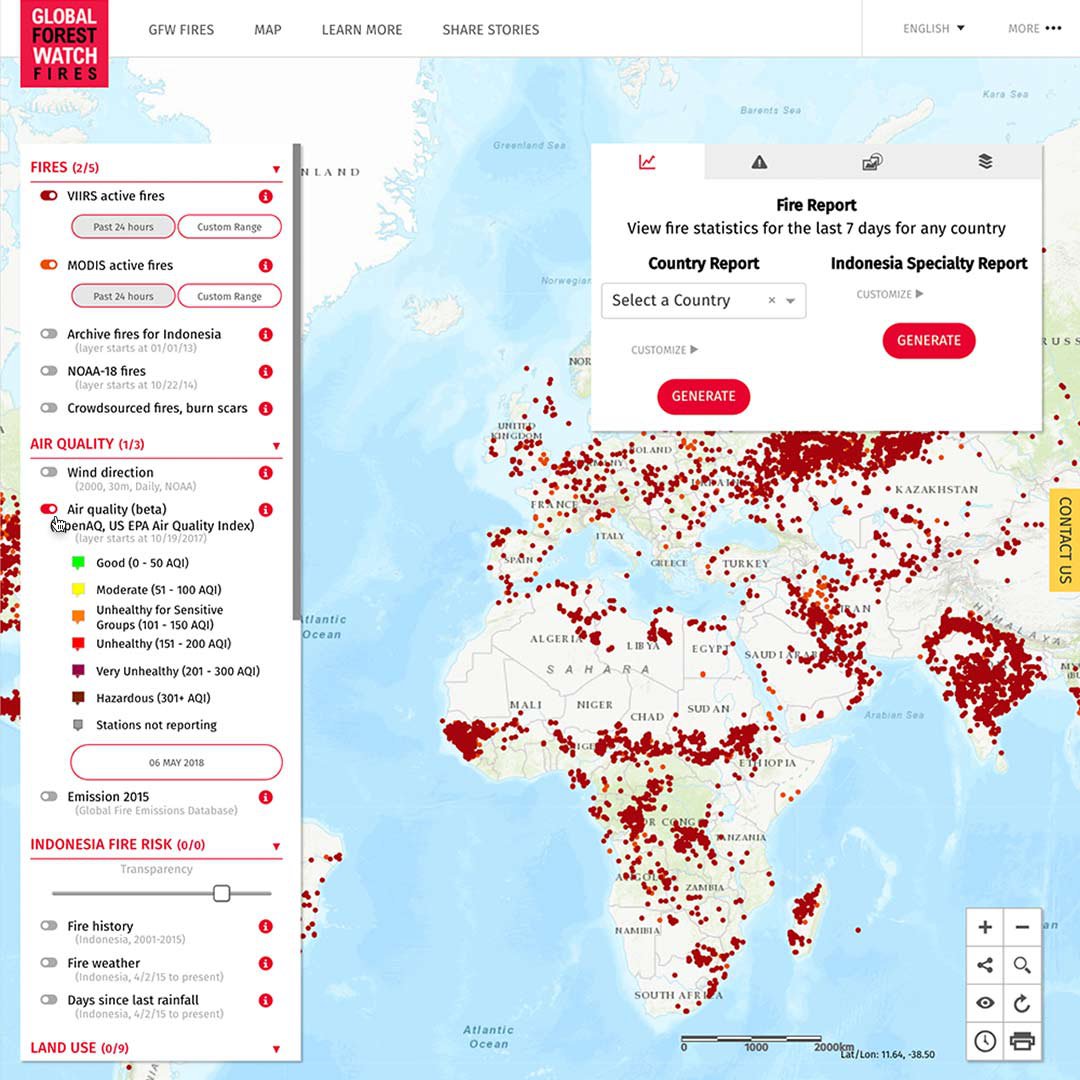
Here you can see fires around the world, look at air quality and haze, and quickly access a fire report for any country in the past seven days.
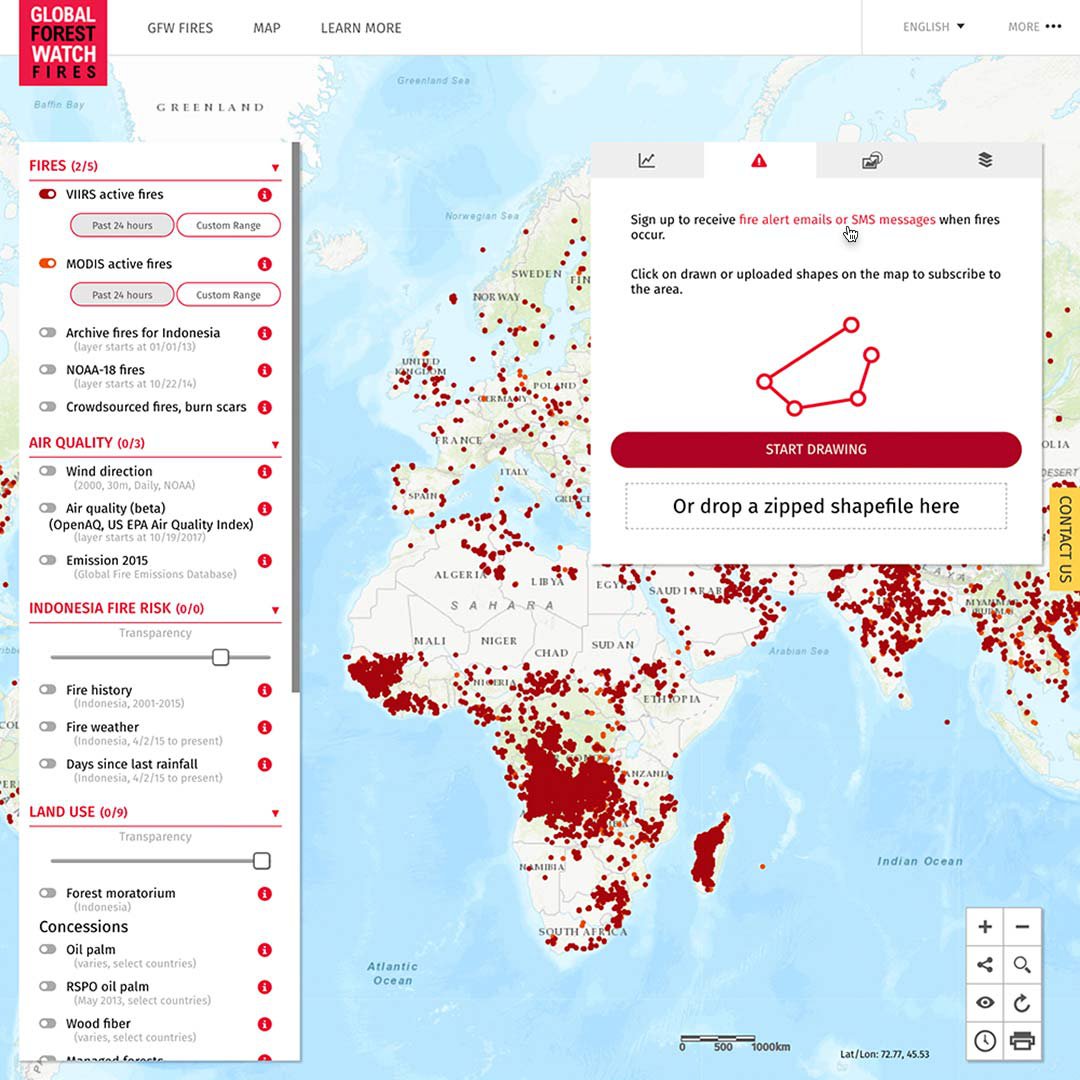
You can also sign up to receive fire alerts via SMS or email for any region you need. Click Start Drawing and outline the desired area. Then click Fire alerts email or SMS messages.
Analyse commodity supply chains.
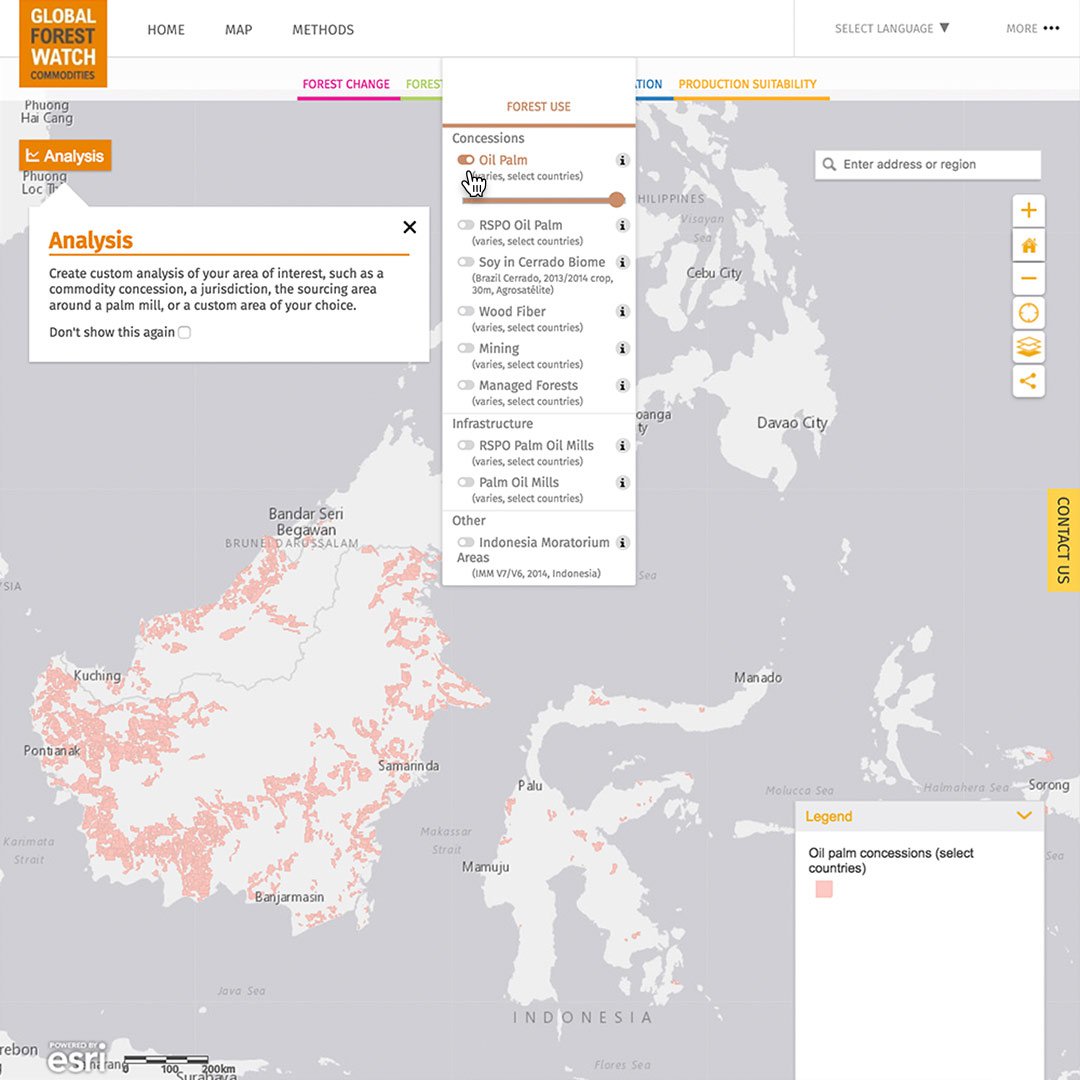
The GFW Commodities tool illuminates deforestation related to commodity supply chains for palm oil, soy, beef, wood pulp, and other products. For example, you can monitor activity in Indonesia near palm oil mills to see if there is corresponding forest loss in the area. This tool may be extremely useful for journalists covering the intersection of business interests and environmental preservation.
From any page, you can click on More to access additional GFW apps.
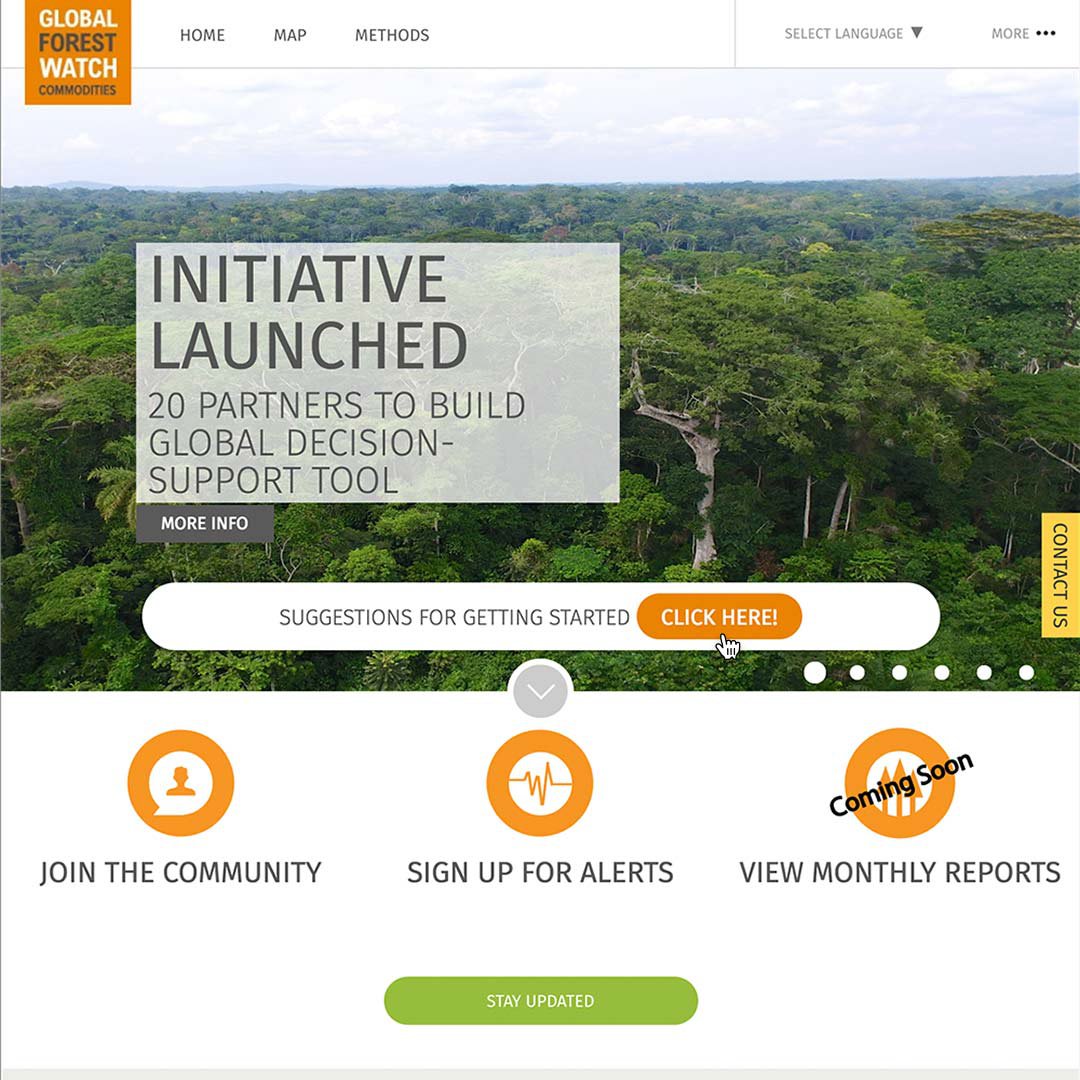
Then click Global Forest Watch Commodities.
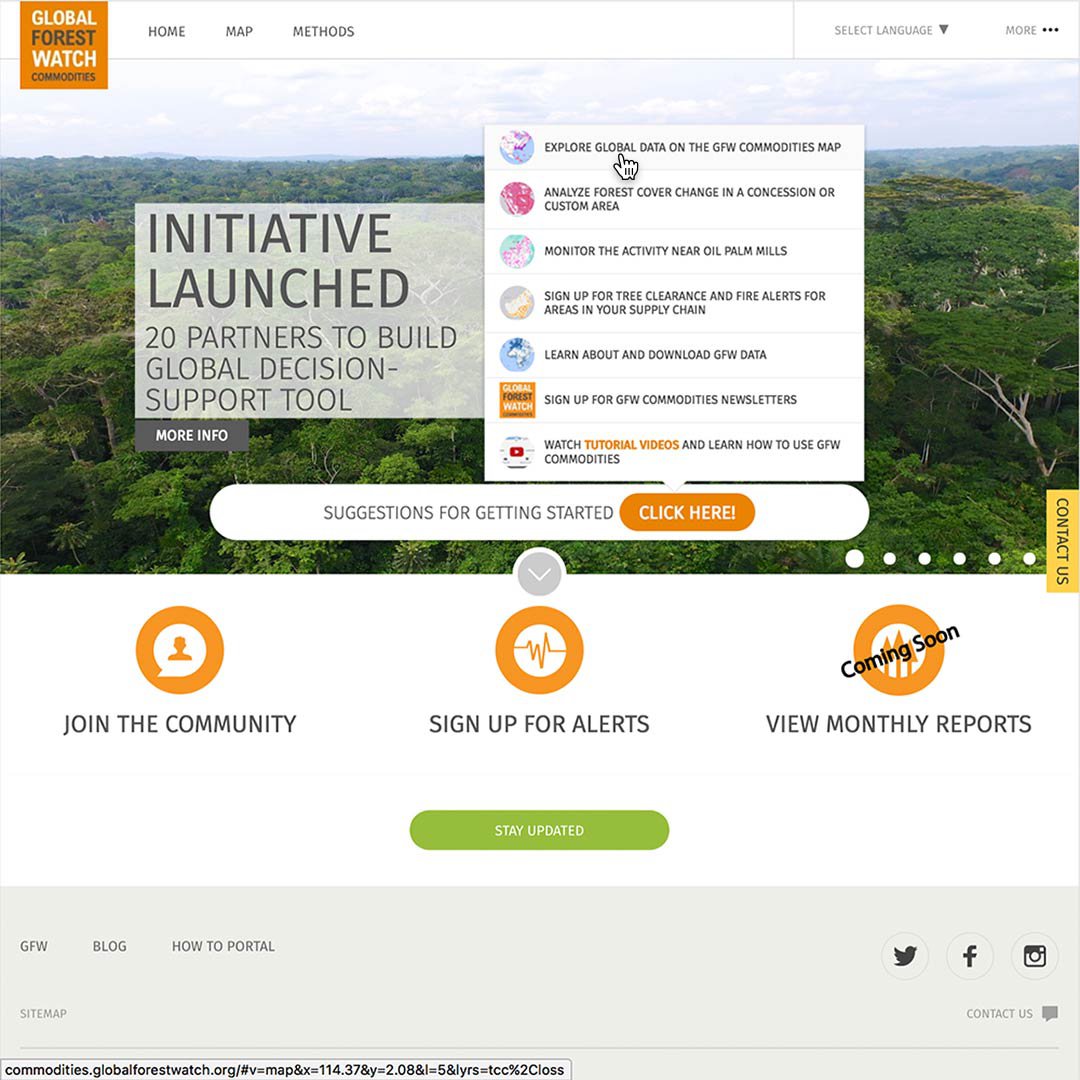
Click the Click Here! button.
Then select Explore Global Data on the GFW Commodities Map.
Under Forest Use, turn on RSPO Palm Oils Mills and Palm Oil Mills.
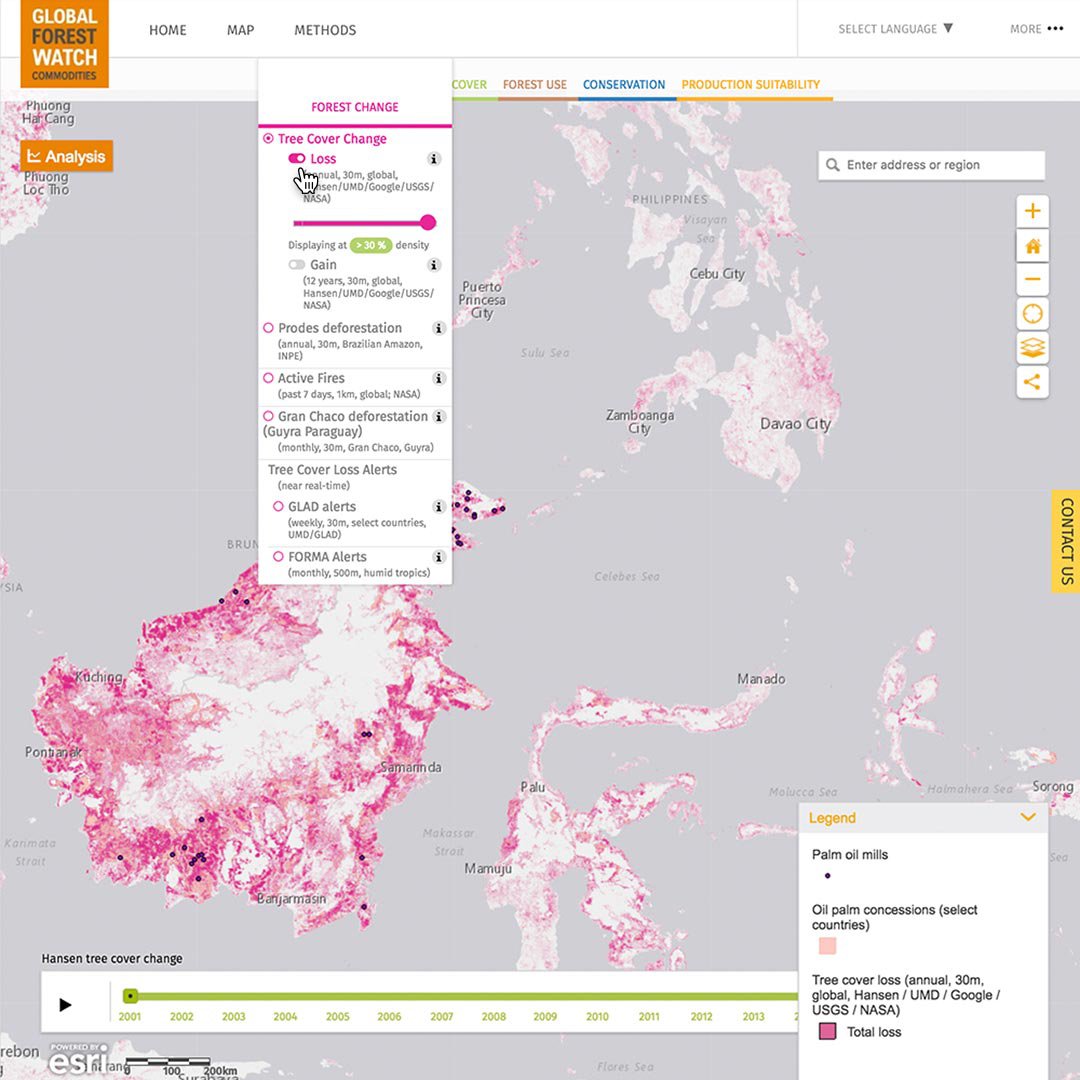
Then under Forest Change, turn on Loss to see the Tree Cover Change in that area. You can adjust the opacity of the layer with the slider so you can continue seeing the details beneath.
Learn more about GFW.
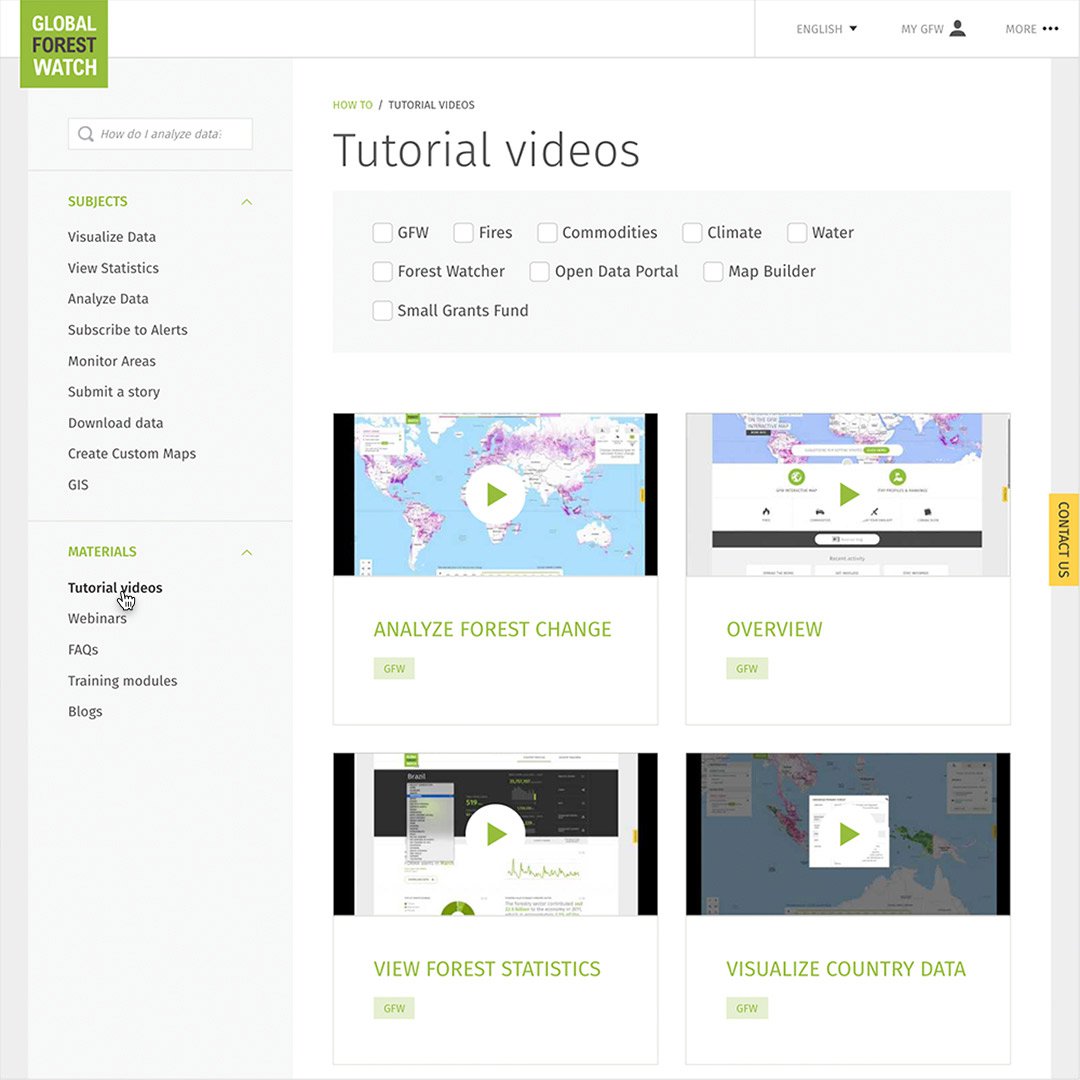
The GFW platform is an incredibly rich source of information for journalists. While this lesson provides an overview of its tools, there are many video tutorials you can watch to dive deeper.
For videos on analyzing forest change, visualizing country data, comparing countries and much more, watch Global Forest Watch Tutorial videos.
-
![GO801_GNI_2-StepVerification_Title-Card.jpg]()
2-Step Verification: Stronger security for your Google account.
課程Add an extra layer of protection beyond your password. -
![YouTube Thumbnails (16)]()
-
![GO801_GNI_TranslationsOTG_TitleCard.jpg]()