Election visualizations linked to Google Sheets
Keep your election visualizations live by linking them to Google sheets

Lesson overview
Keep your election visuals up to date with Google Sheets and Flourish
Flourish makes it even easier for you to keep your election data up to date: Thanks to the Flourish live CSV, you can link to a web-accessible CSV file instead of uploading your file to Flourish manually.
- Visualizing seat changes in the EU parliament
- Implementing your URL in Flourish
- Customizing your visualization in Flourish

Visualizing seat changes in the EU parliament using sheets and Flourish
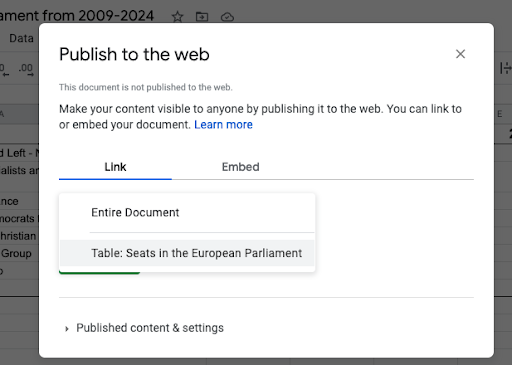
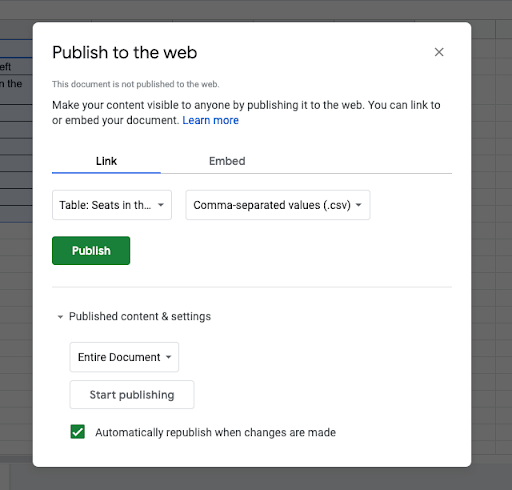
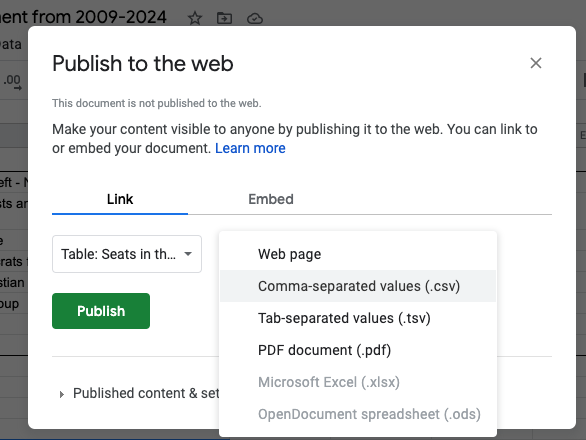
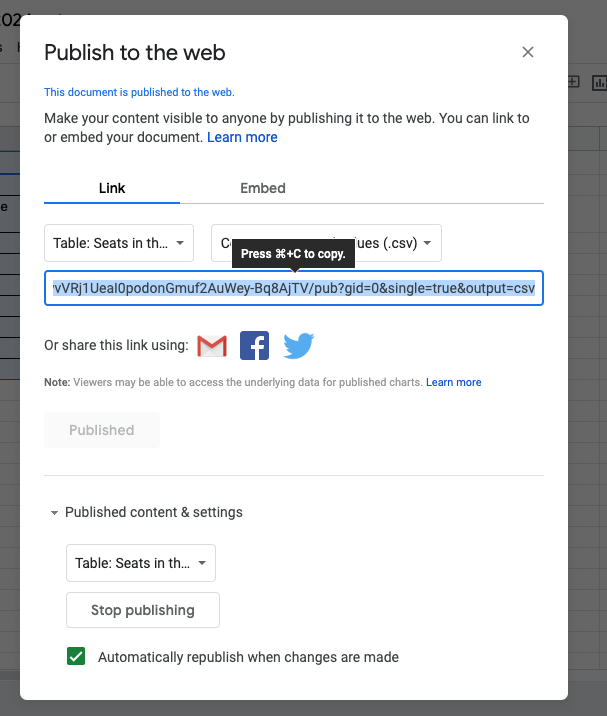
Linking a Google sheet to a visualisation unlocks the power of sheets. You can scrape data directly into a visualisation or just update it quickly on the fly. These steps will take you through setting up the link between a Google Sheet and Flourish.
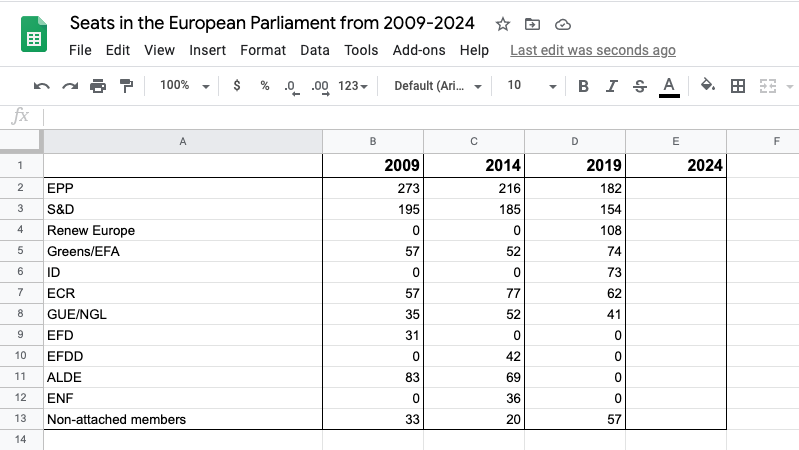
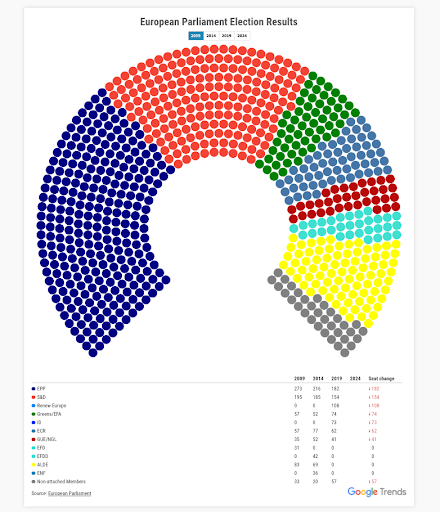
Start with a dataset that you want to visualize. This table shows the distribution of seats in the EU Parliament from 2009 to 2024. Let's say you would like to visualize this data set with Flourish and automatically update it using the Live CSV function.
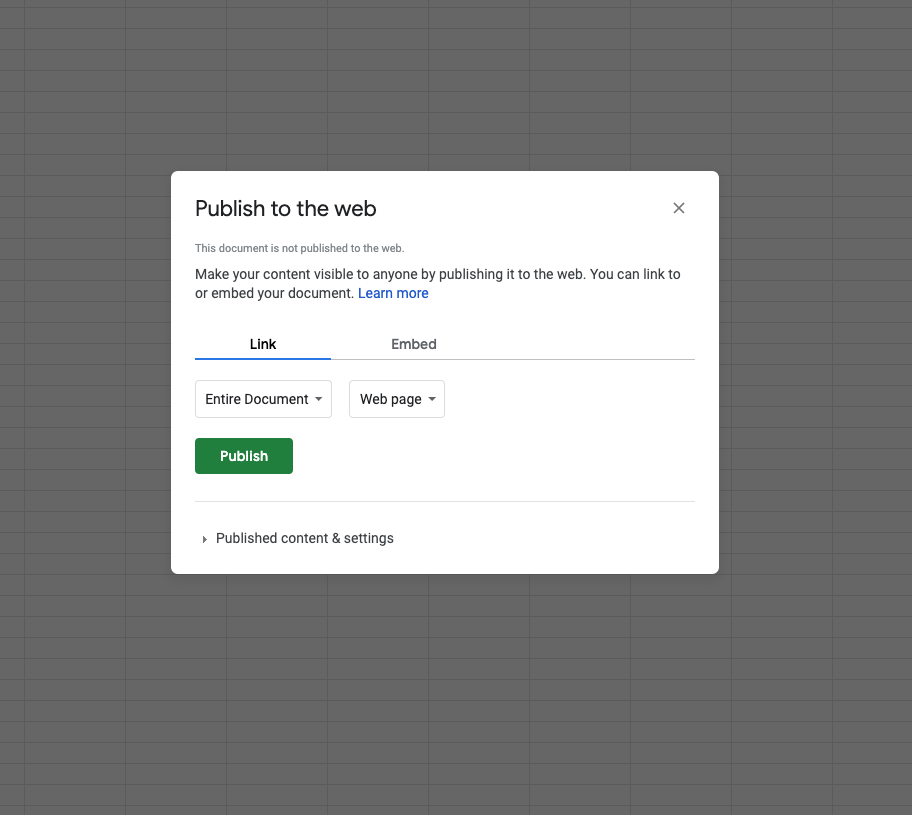
In order to be able to use the table with the Flourish Live CSV feature, we have to publish it first: Click on “File” in the Sheets menu. Continue with clicking the “Publish to web” tab. A new window should open.
For the visualization of the EU parliament, to be available in Flourish we need to link the Google Sheet to Flourish
In order to use the Live CSV feature in Flourish, the Google Sheet needs to be published as a CSV file. To publish the sheet as a CSV, click on the drop down menu on the right and choose the option “Comma-separated values (.csv)”.
There’s another drop down menu called “Published content & settings”. To keep the data up to date, click on the box “Automatically republish when changes are made”.Click “Publish”.
Copy the link to use it in Flourish later on.


Implementing your URL in Flourish
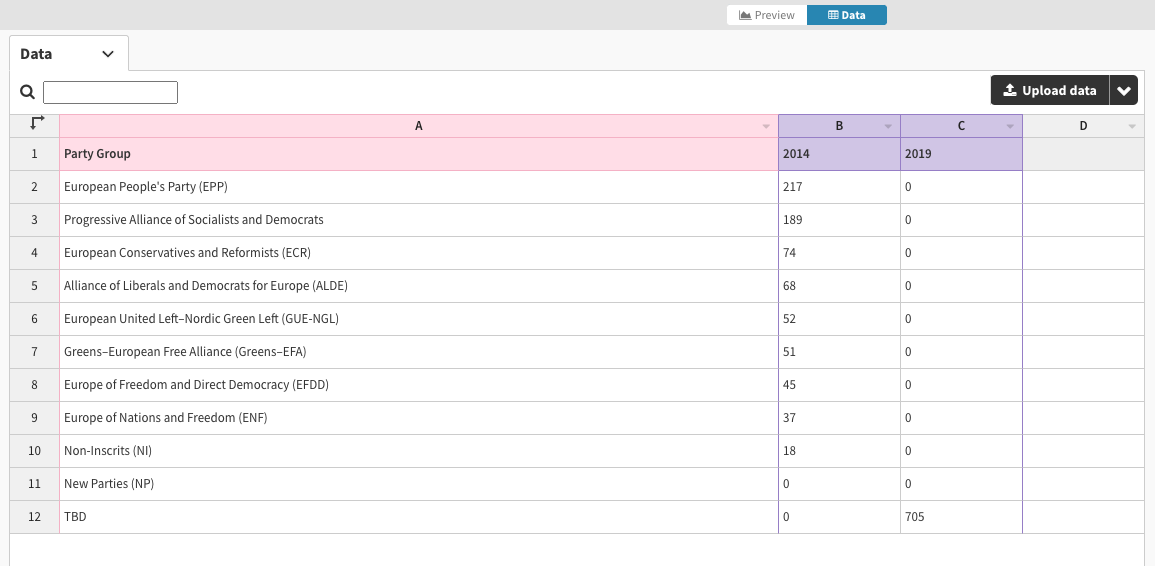
Link your data sheet to your visualization to update the values automatically
Go to Flourish: Choose a visualization that you would like to create using the Live CSV feature. Open the visualization and click “Data”. You will see a drop down menu on the right.
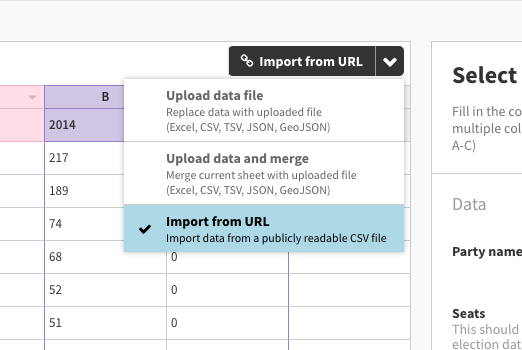
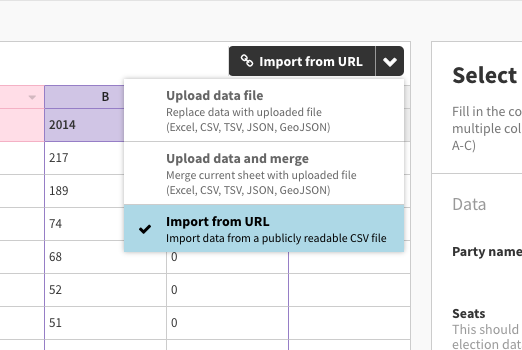
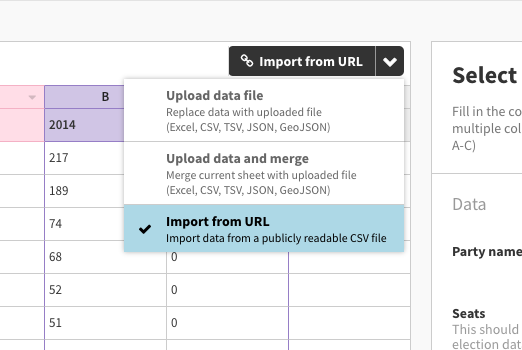
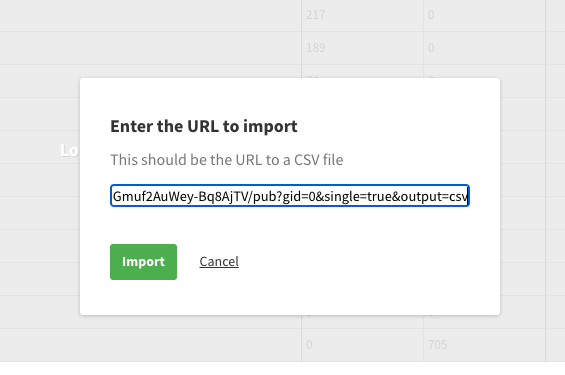
Click on the drop down tab and choose between “Upload data file”“Upload and merge”and “Import from URL”.To use the Live CSV function, select “Import from URL”.
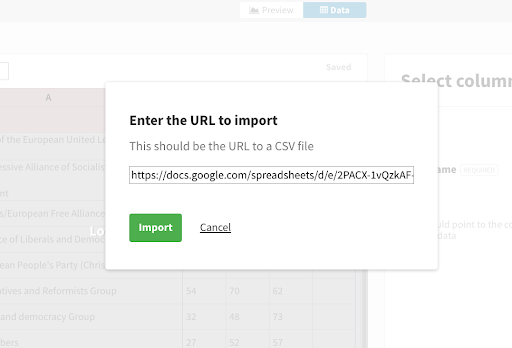
Paste the Google Sheet URL and click "Import".
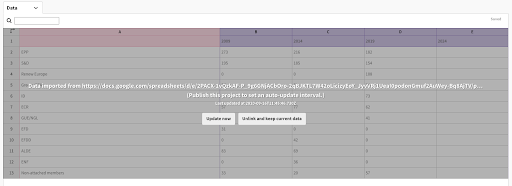
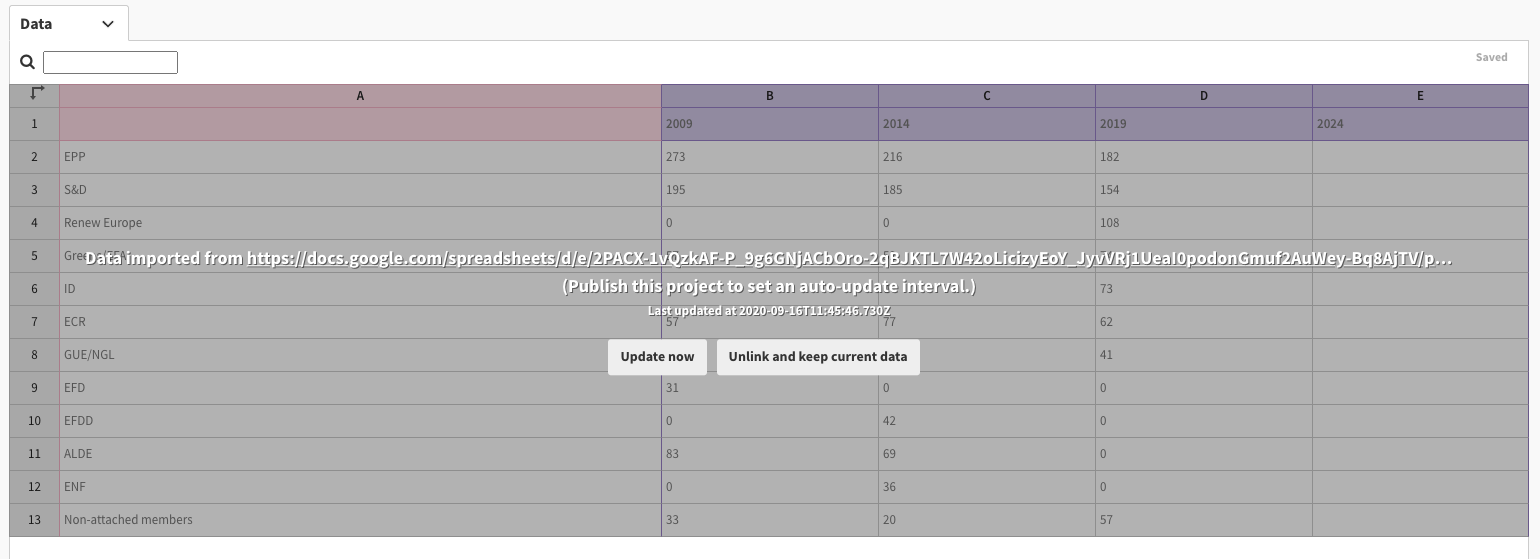
Your sheet should be linked to your Flourish visualization now.The data sheet will look greyed out. There will not be an option to edit the values in Flourish.


Customizing your visualization in Flourish
The final step is to customise the appearance of the visualization
To make changes to the visualization, first you have to unlink your Google Sheet from Flourish temporarily. Go to your data sheet in FlourishClick “Unlink and keep current data”The grey overlay should disappear afterwards. You can start editing your visualization now.
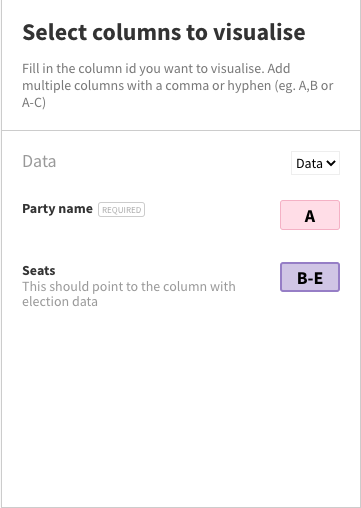
First, switch from “data” to “preview”To make sure the correct values are being displayed in the visualization, go to “Select columns to visualise” and pick the columns you would like to be used in the parliament chart.In this case, you need columns B to E to visualize the seats correctly.
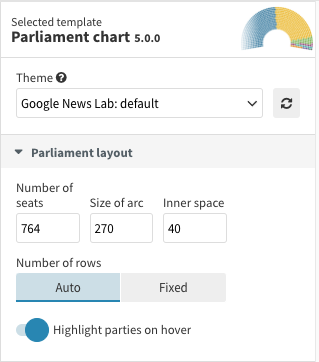
The number of seats in the parliament chart can be adjusted in Flourish. In 2009, 764 members were elected The European Parliament. Go to “Parliament Layout”Change the number of seats.
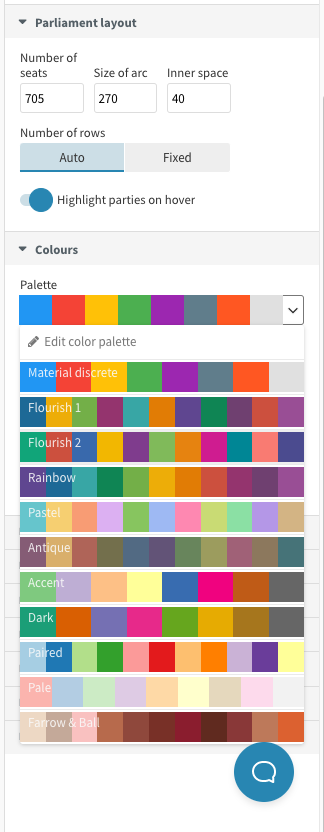
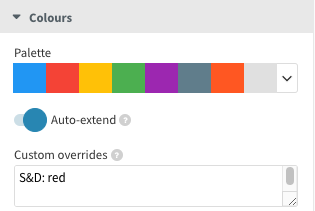
To adjust the colors in the visualization: Switch from “data” to “preview”Open the tab “Colours”Choose a preset design or customize displayed colours
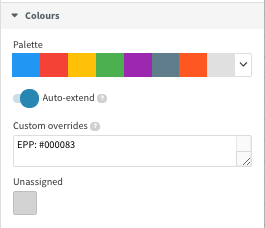
A custom color palette is available too: Click into the field “Custom overrides”Put in a value, separate it with “:” and follow up with a colourExample: S&D: red
To use special color hues, use Hex Colour Codes.
Reconnect the Google Sheet to Flourish after finishing the customization. Go back from “preview” to “data” Click the drop down menu on the right and repeat the import process with your Google Sheet.The visualization will be automatically synchronized with the Google Sheet again.
This is the finished visualization! To update the seats in the European Parliament after the 2024 election, add the numbers in your Google sheet and Flourish will update your visualization. Click here for finished example


-
-
Google Earth: Pinpoint eyewitness locations.
課程Find out where a photo was taken and when it was uploaded. -


