


Google Finance: Research company performance

Google Finance allows you to track companies across 53 exchanges on five continents.
Lesson overview
Search global stock market data.
Every day, there are millions of movements on stock markets across the world. Google Finance can help you track the companies and markets that you are reporting on. For a full list of the stock exchanges tracked on Google Finance, click here.
- Find companies and build a watch list
- Research and compare companies
For more Business Reporting lessons, visit: newsinitiative.withgoogle.com/training/course/business-reporting
Find companies and build a watch list
Google Finance is a gateway to a huge collection of financial information on listed companies across the globe. You can streamline your workflow by building a list of companies you’d like to follow regularly.
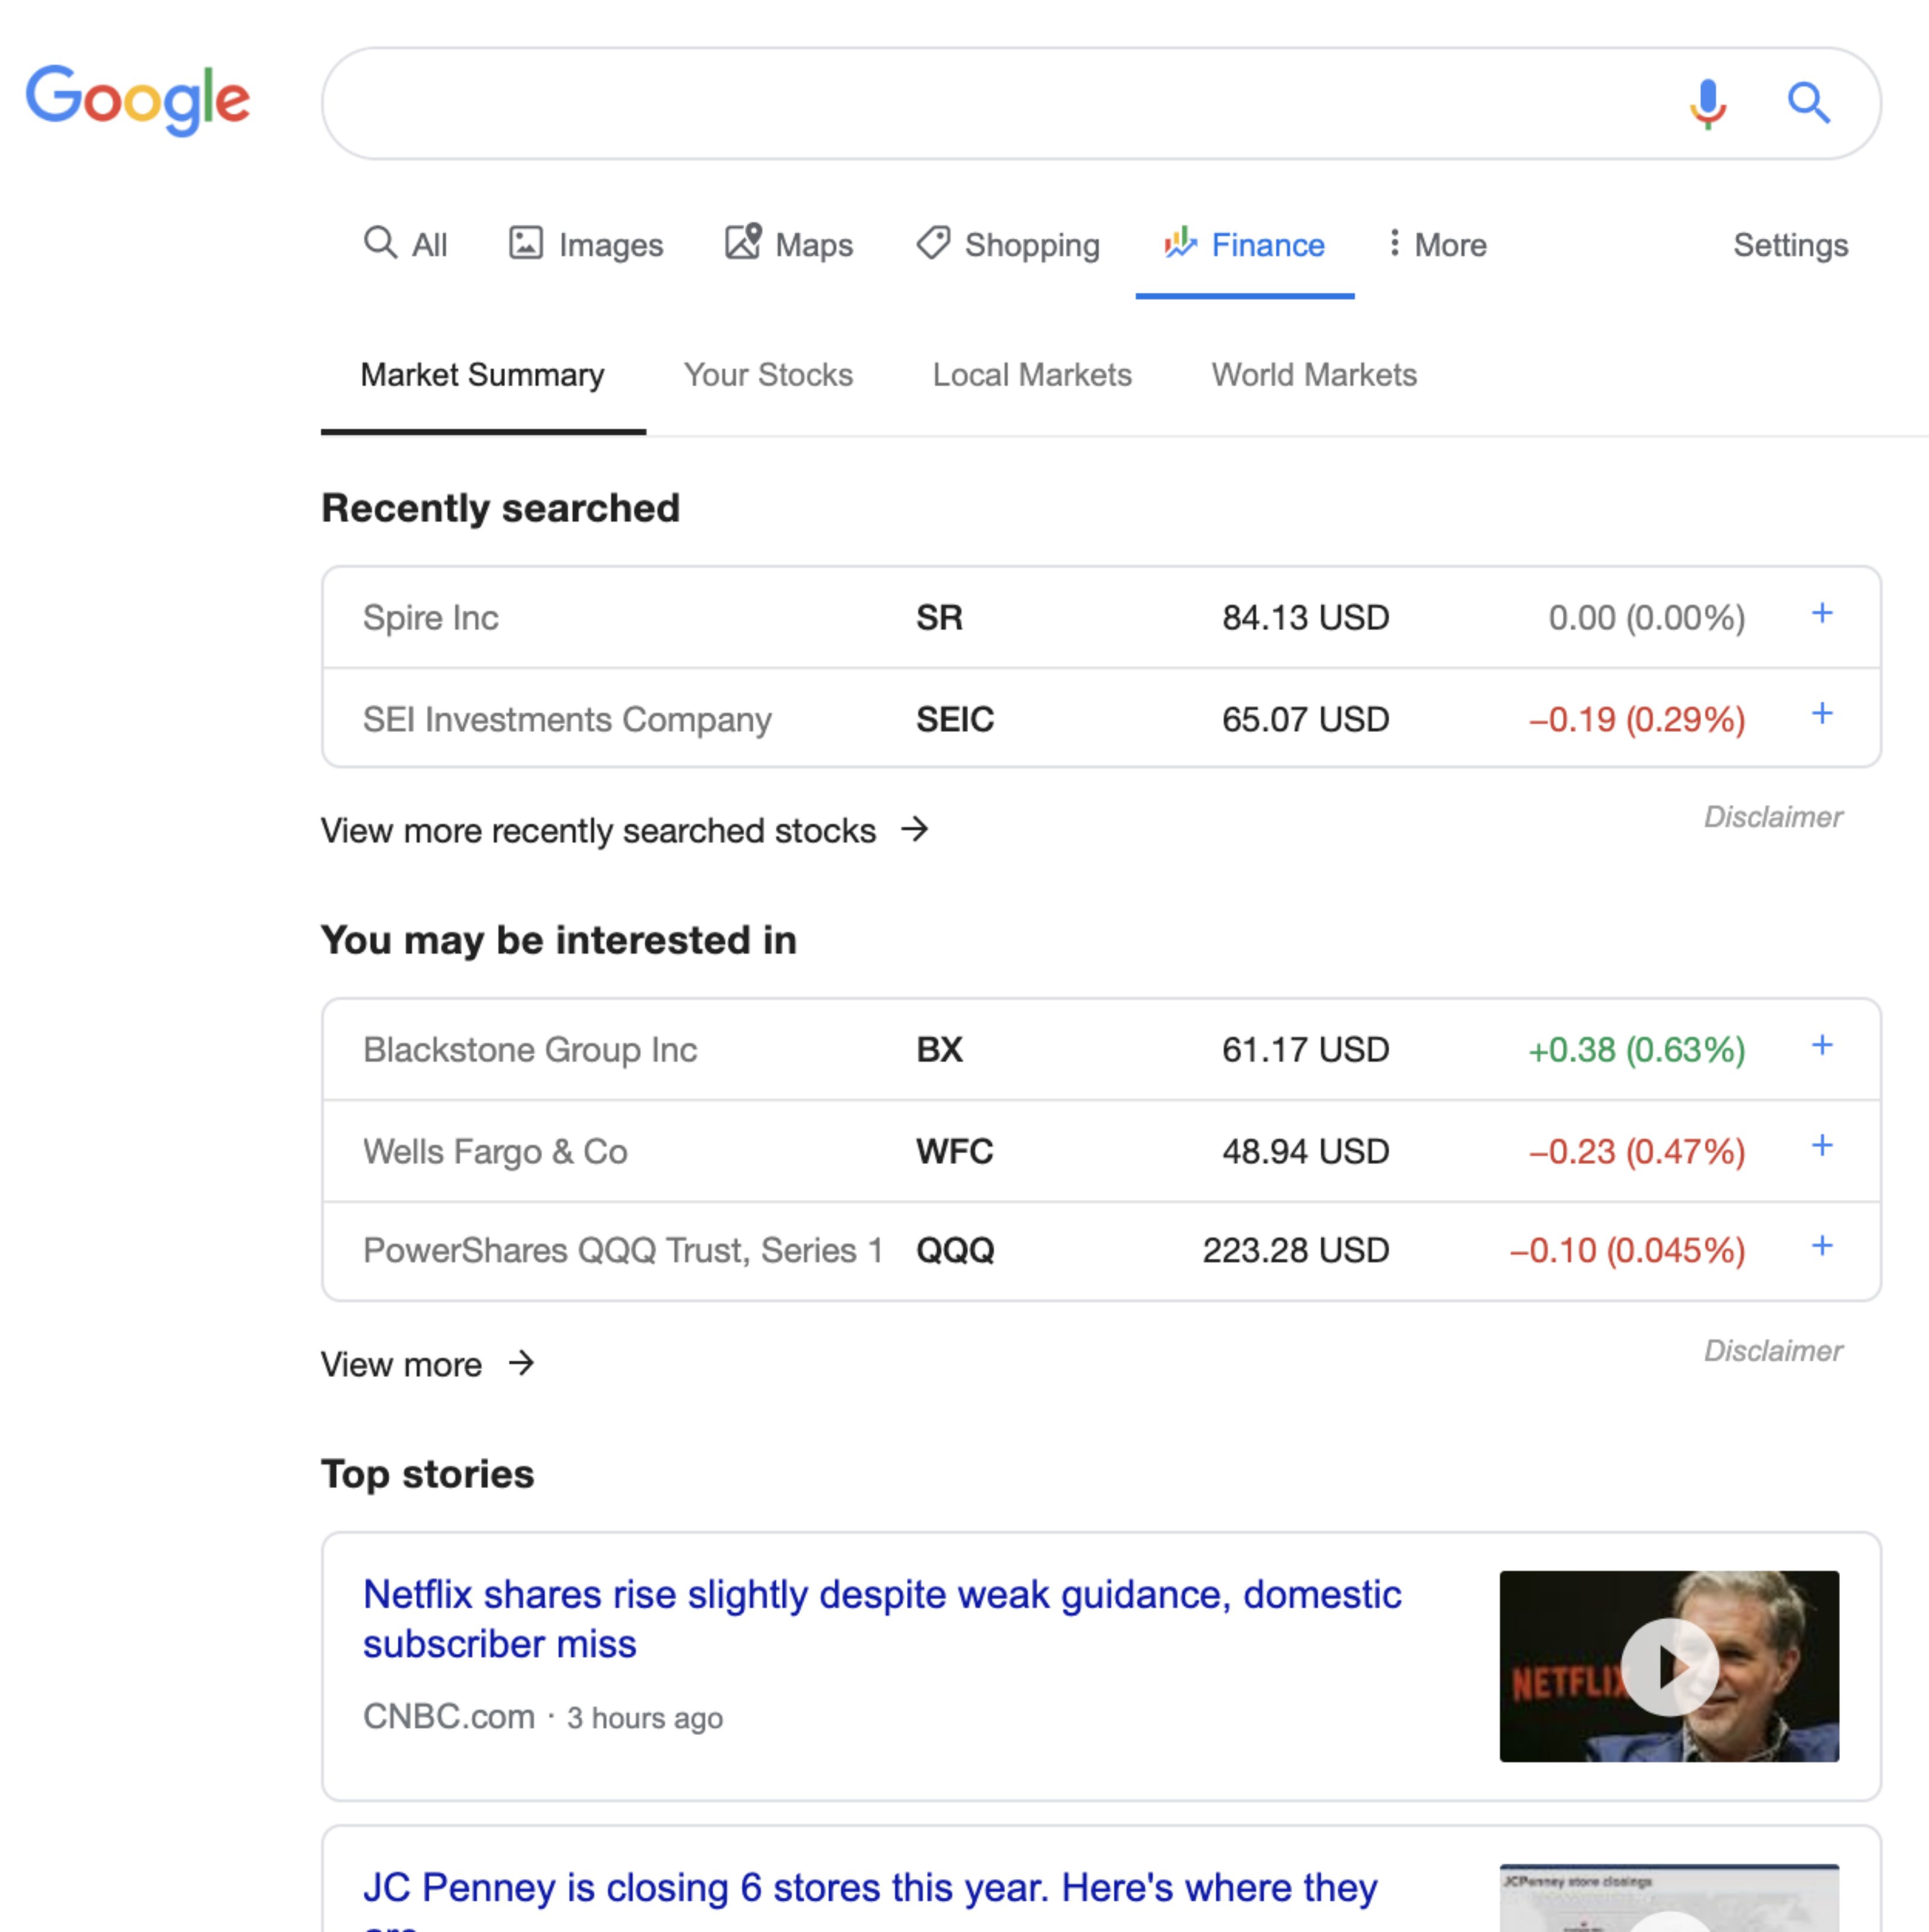
To begin, go to finance.google.com.
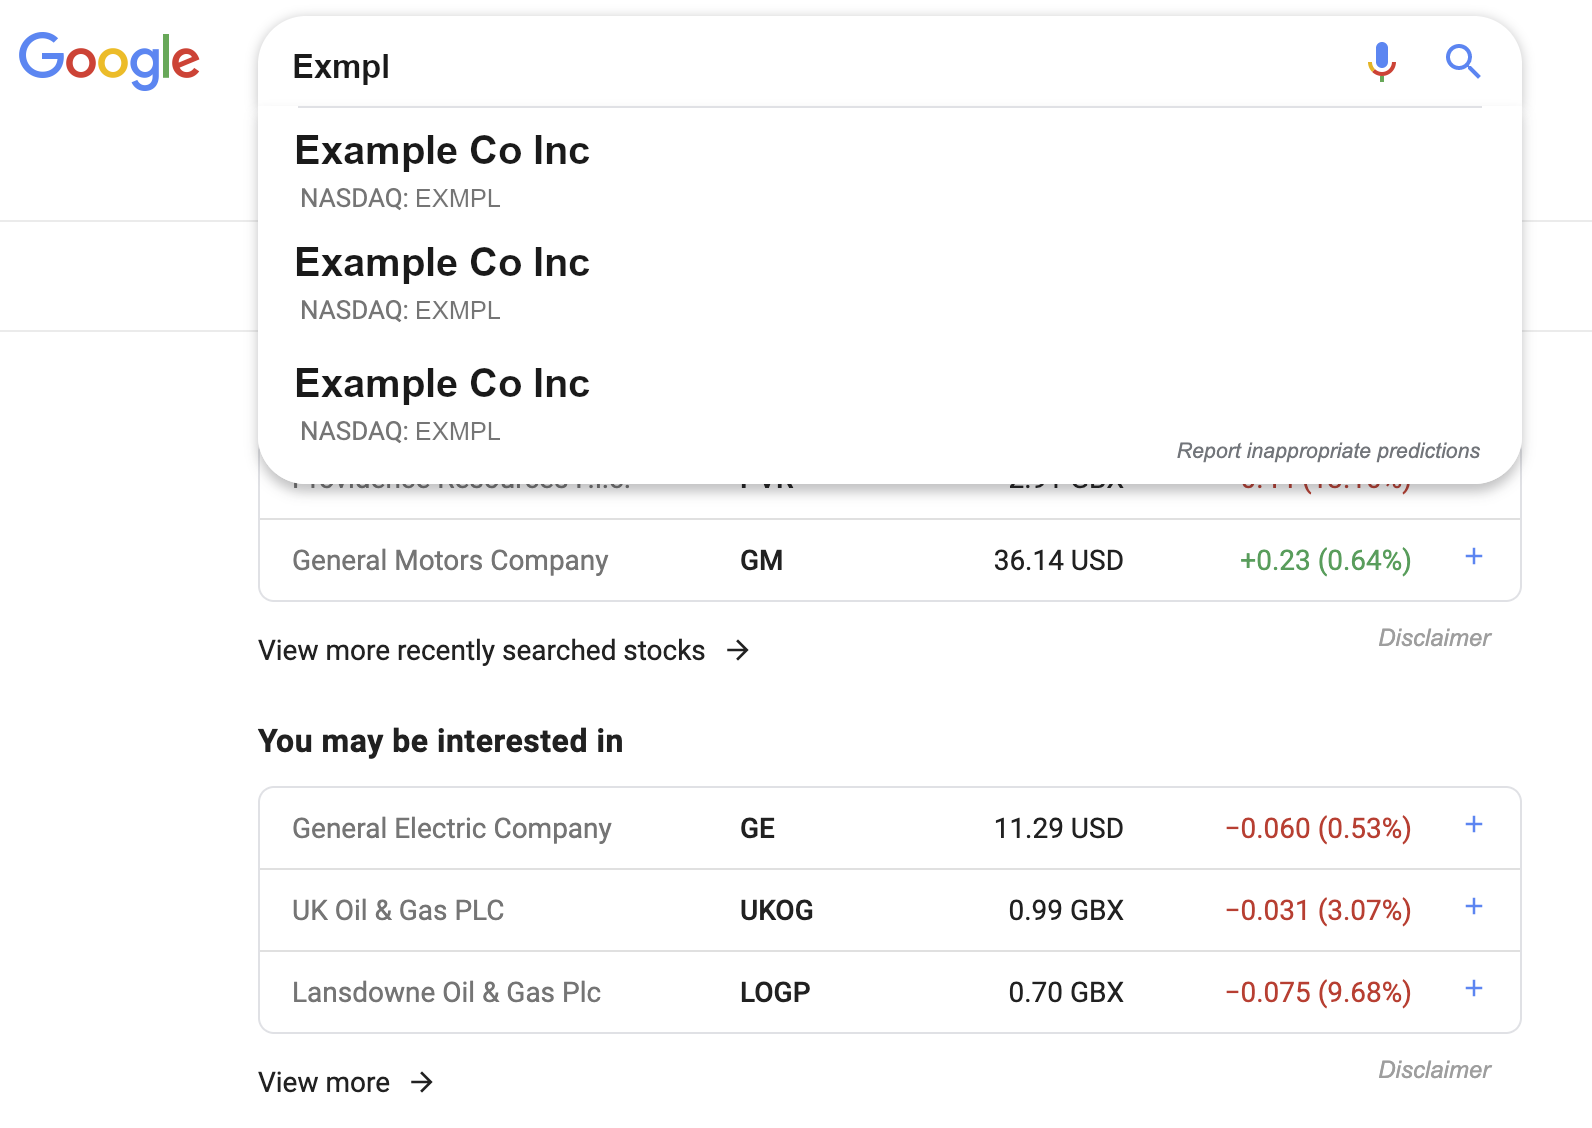
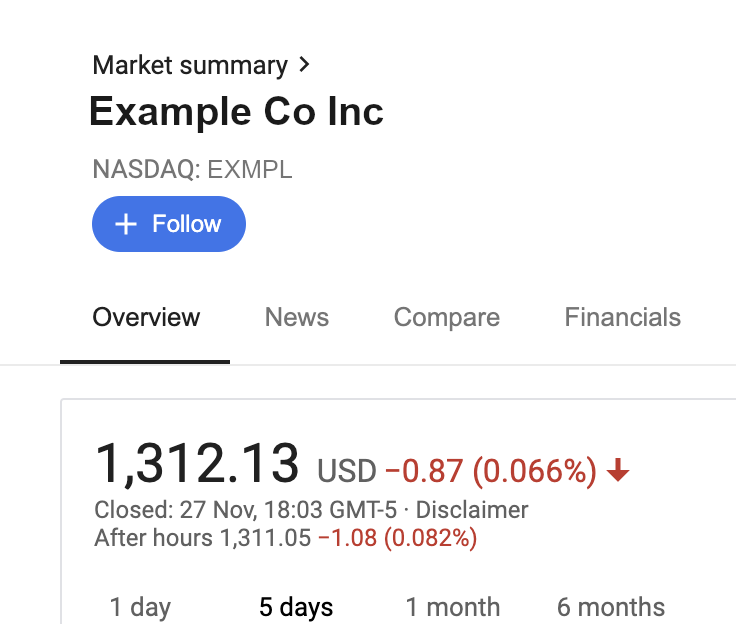
Enter the company name, we have used a fake company "Example Co Inc" it trades on (NASDAQ) and its ticker symbol (EXMPL).
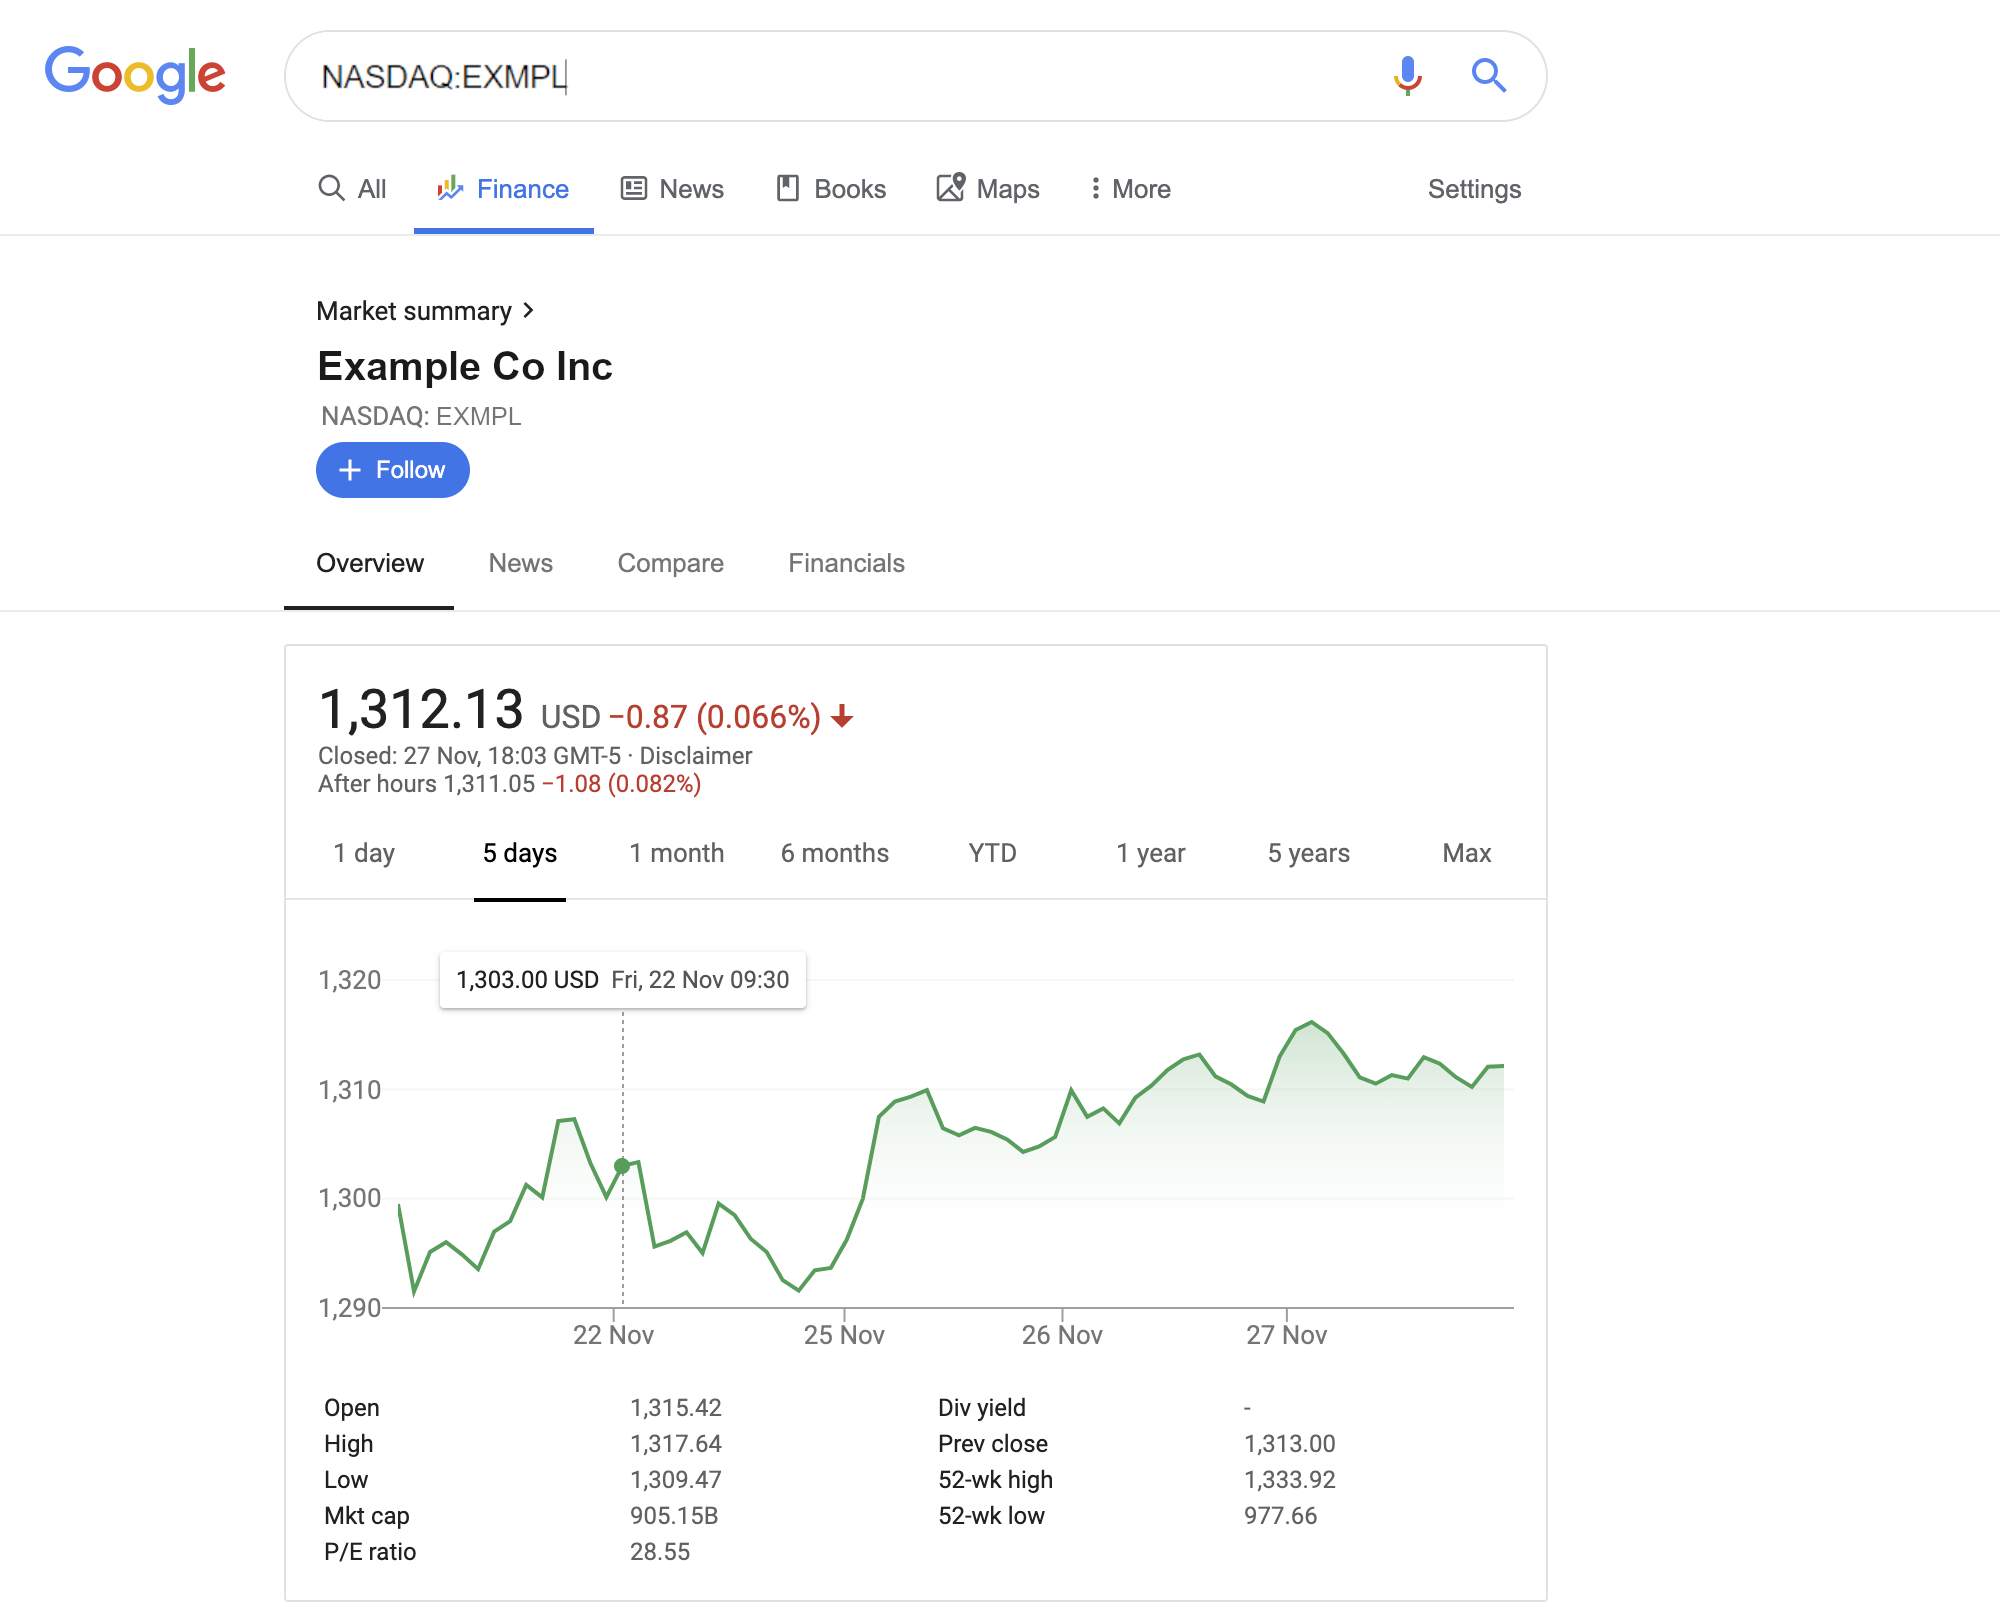
Click on the stock to see an overview, relevant news, and financials.
To save stocks you’re interested in, click Follow.
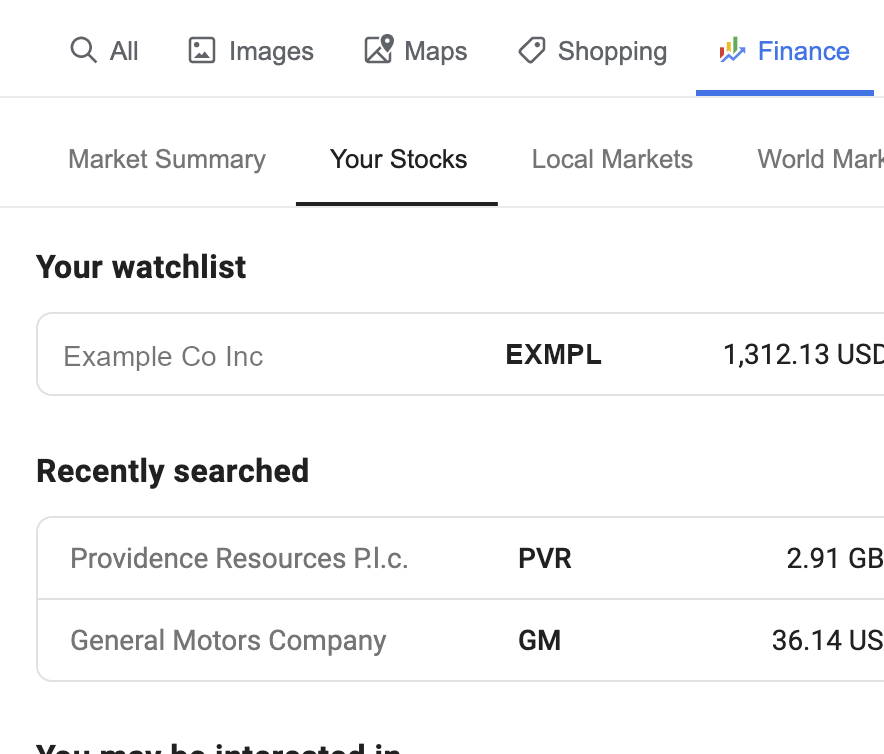
Once you have followed a stock, it will appear in Your watchlist.
Research and compare companies
Google Finance makes it easy to research companies, compare performance, find relevant news, and see recent financials.
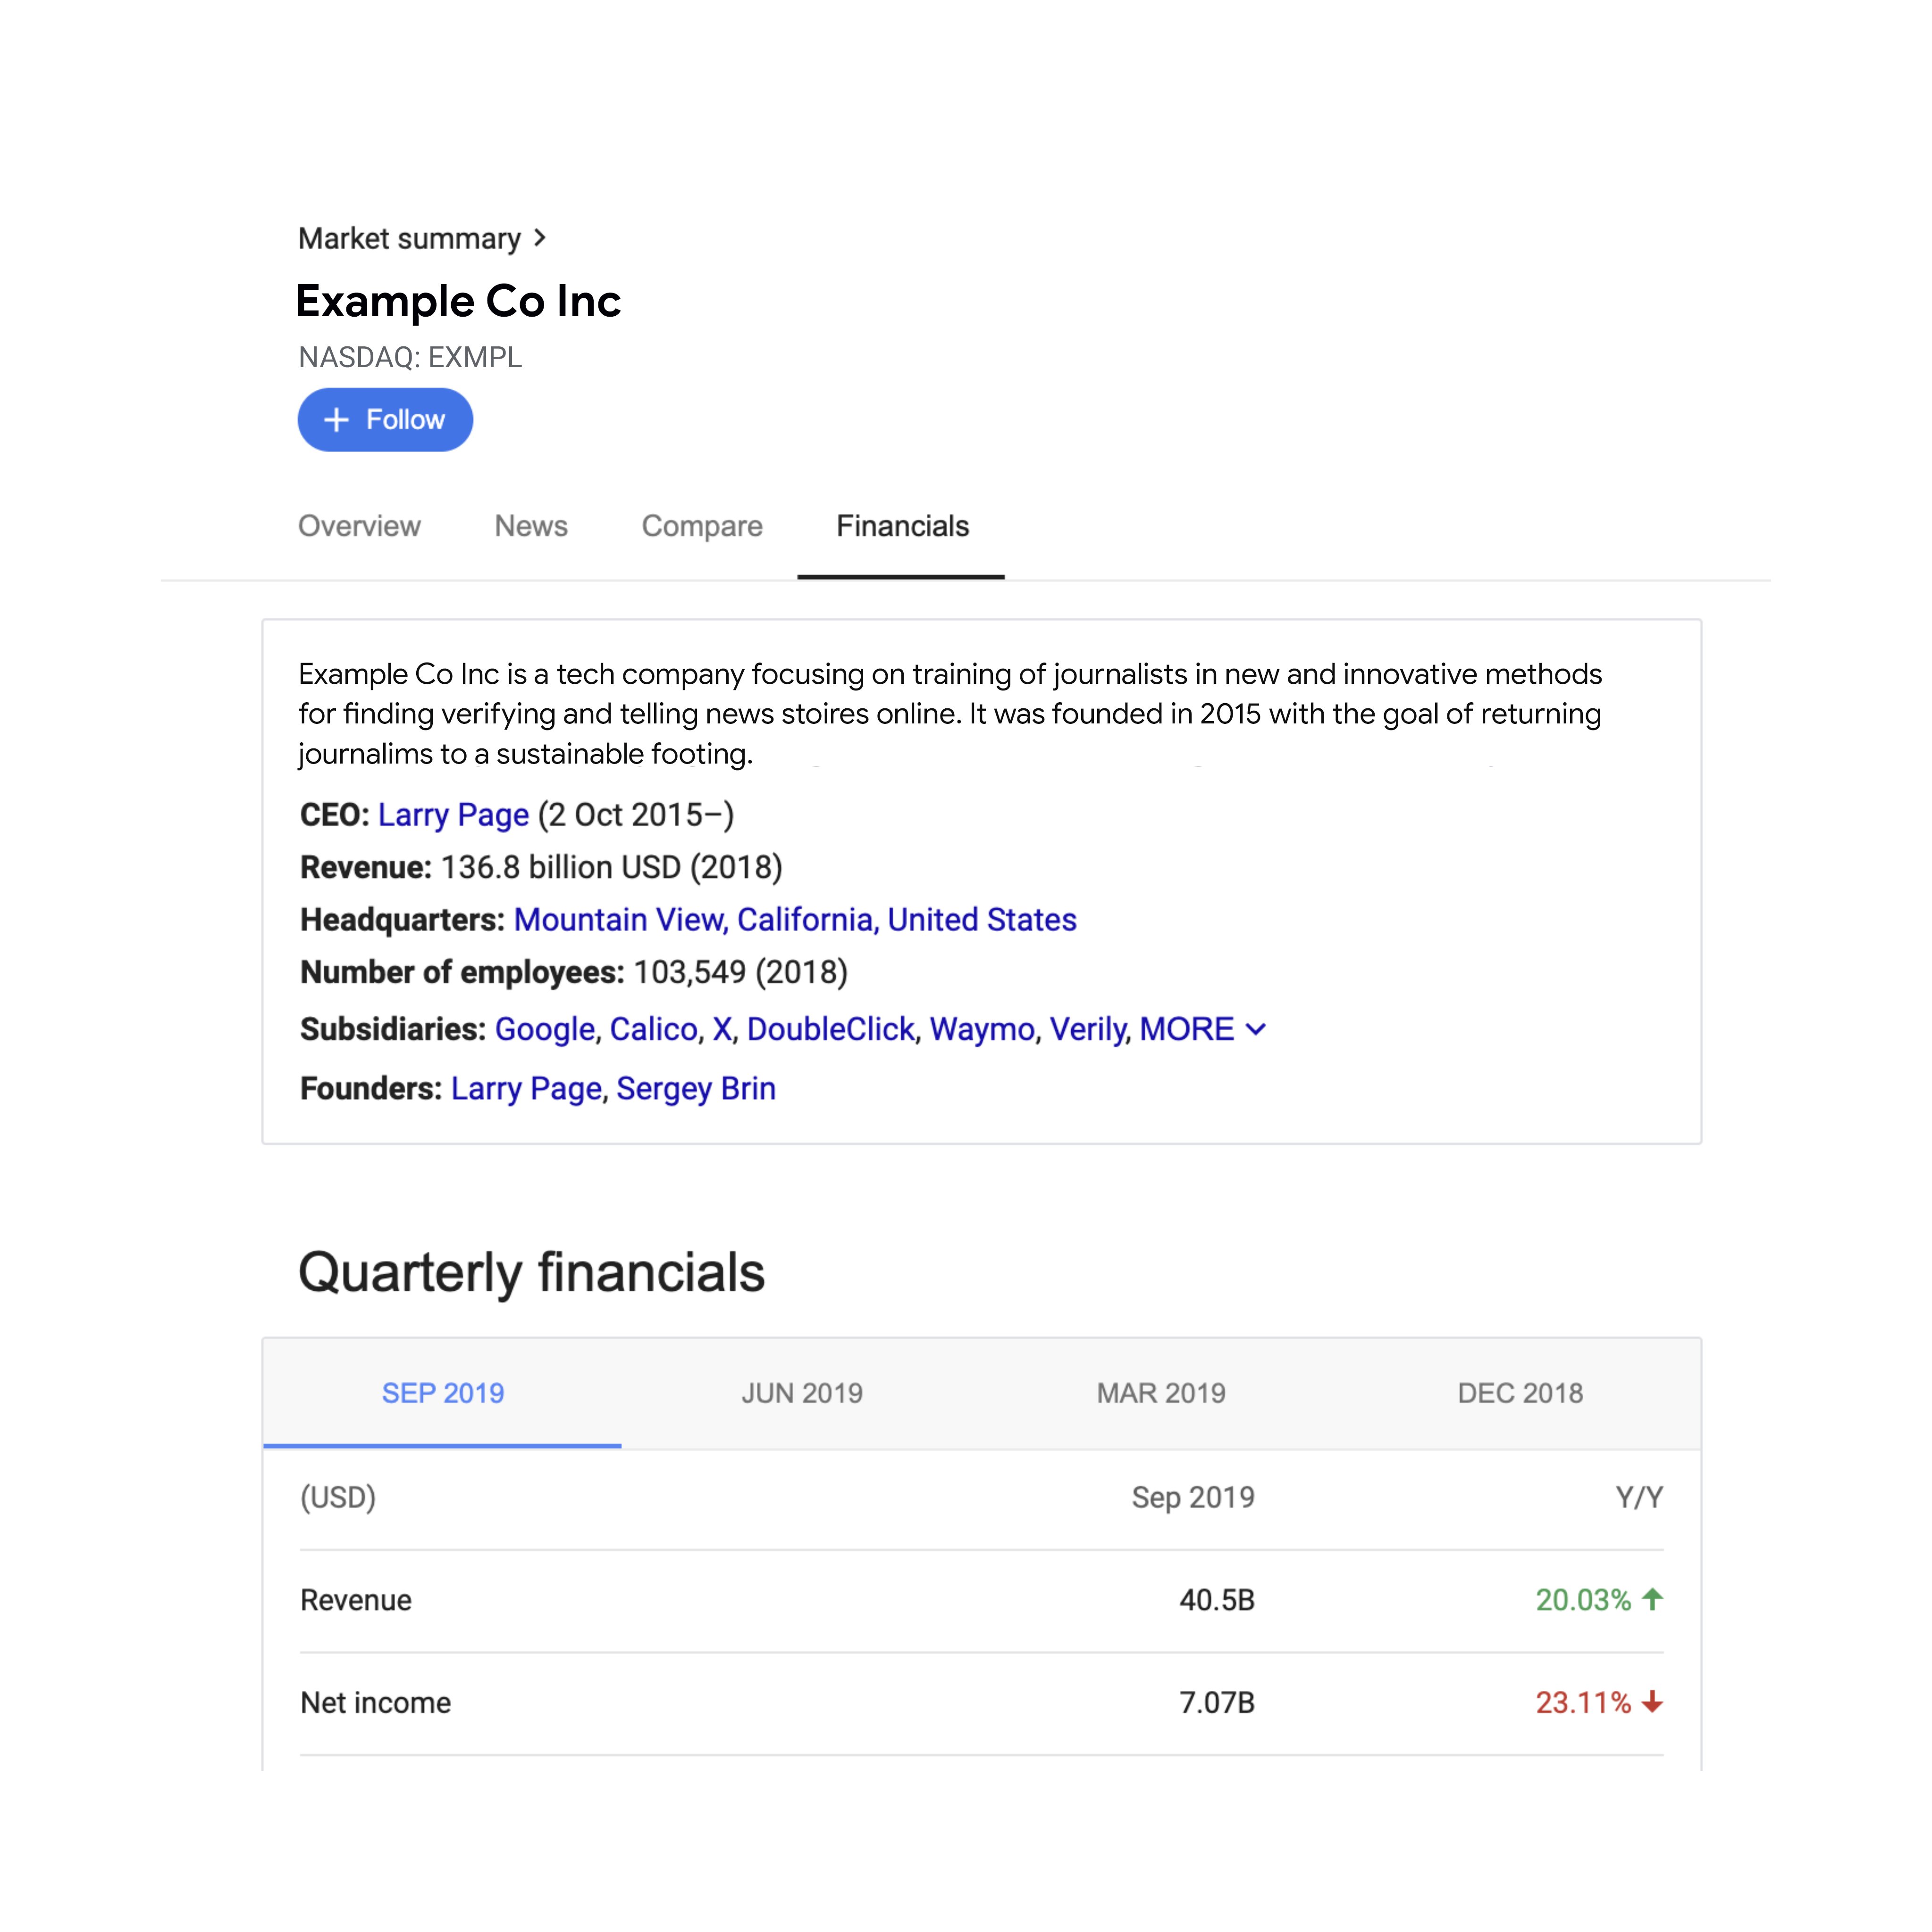
To see quarterly financial information, click Financials. You’ll see the headline details of each financial report by clicking on its date.
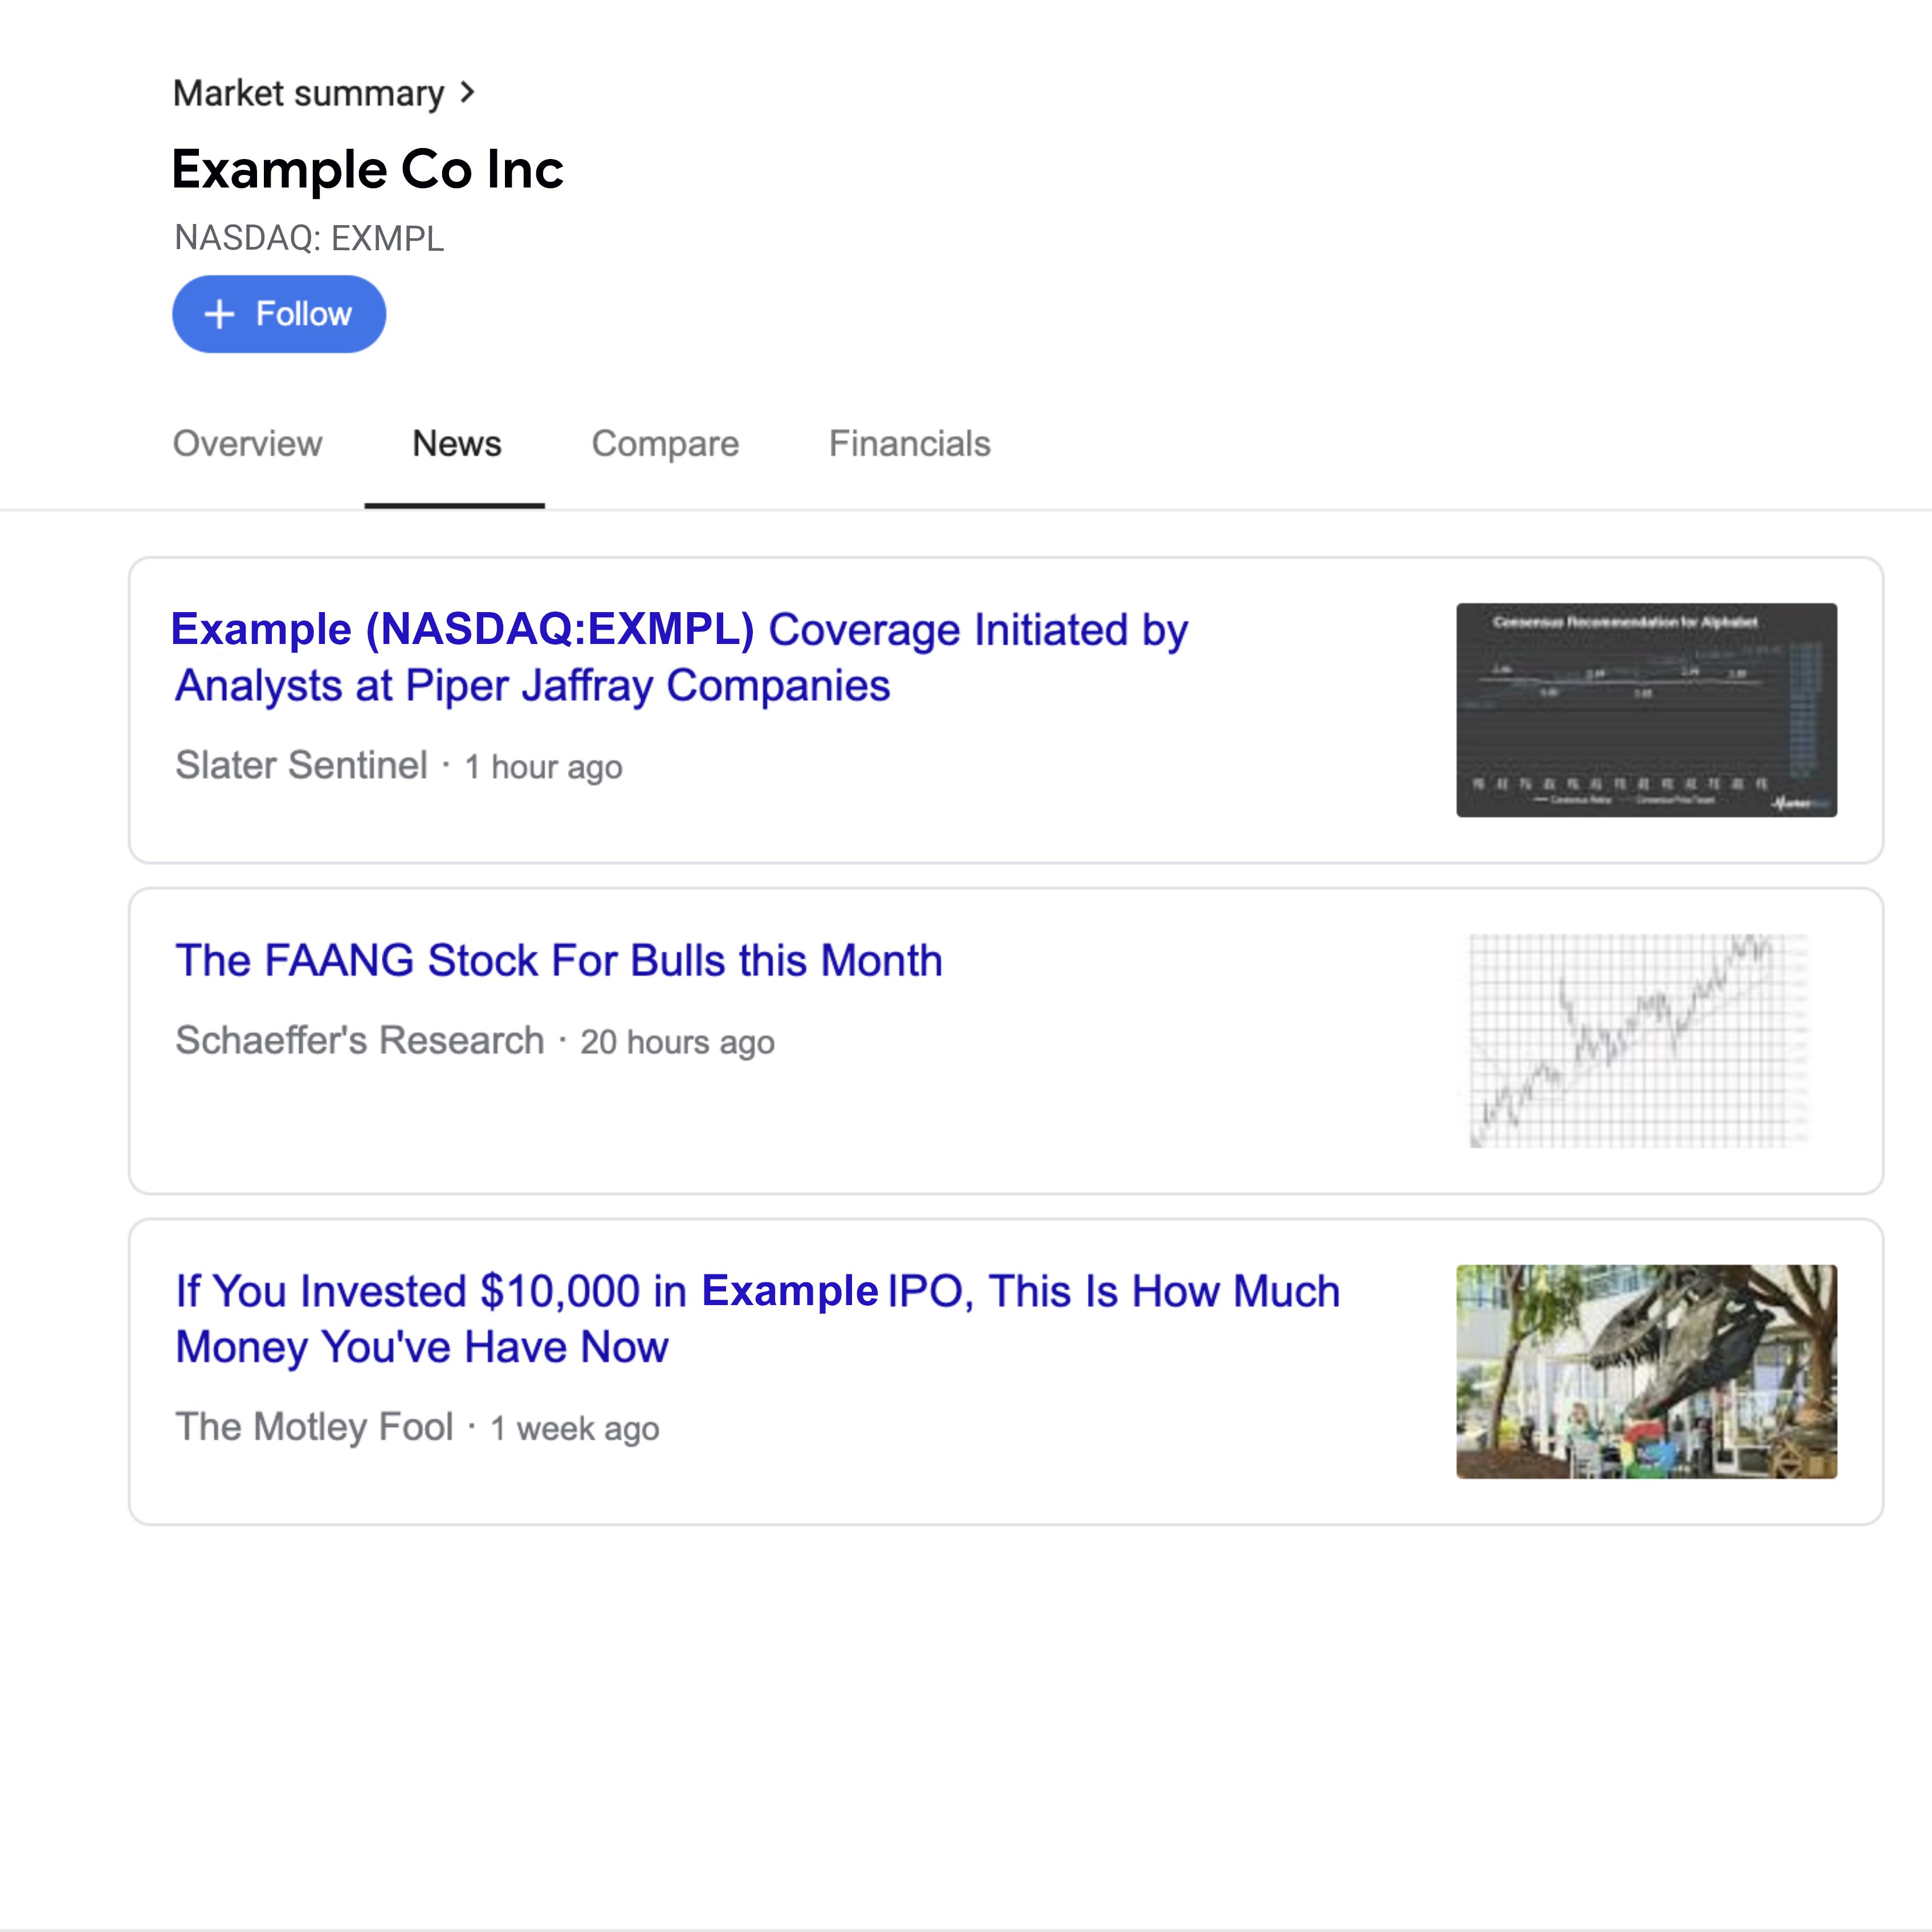
To see the most recent news stories in relation to the company of interest, click News.
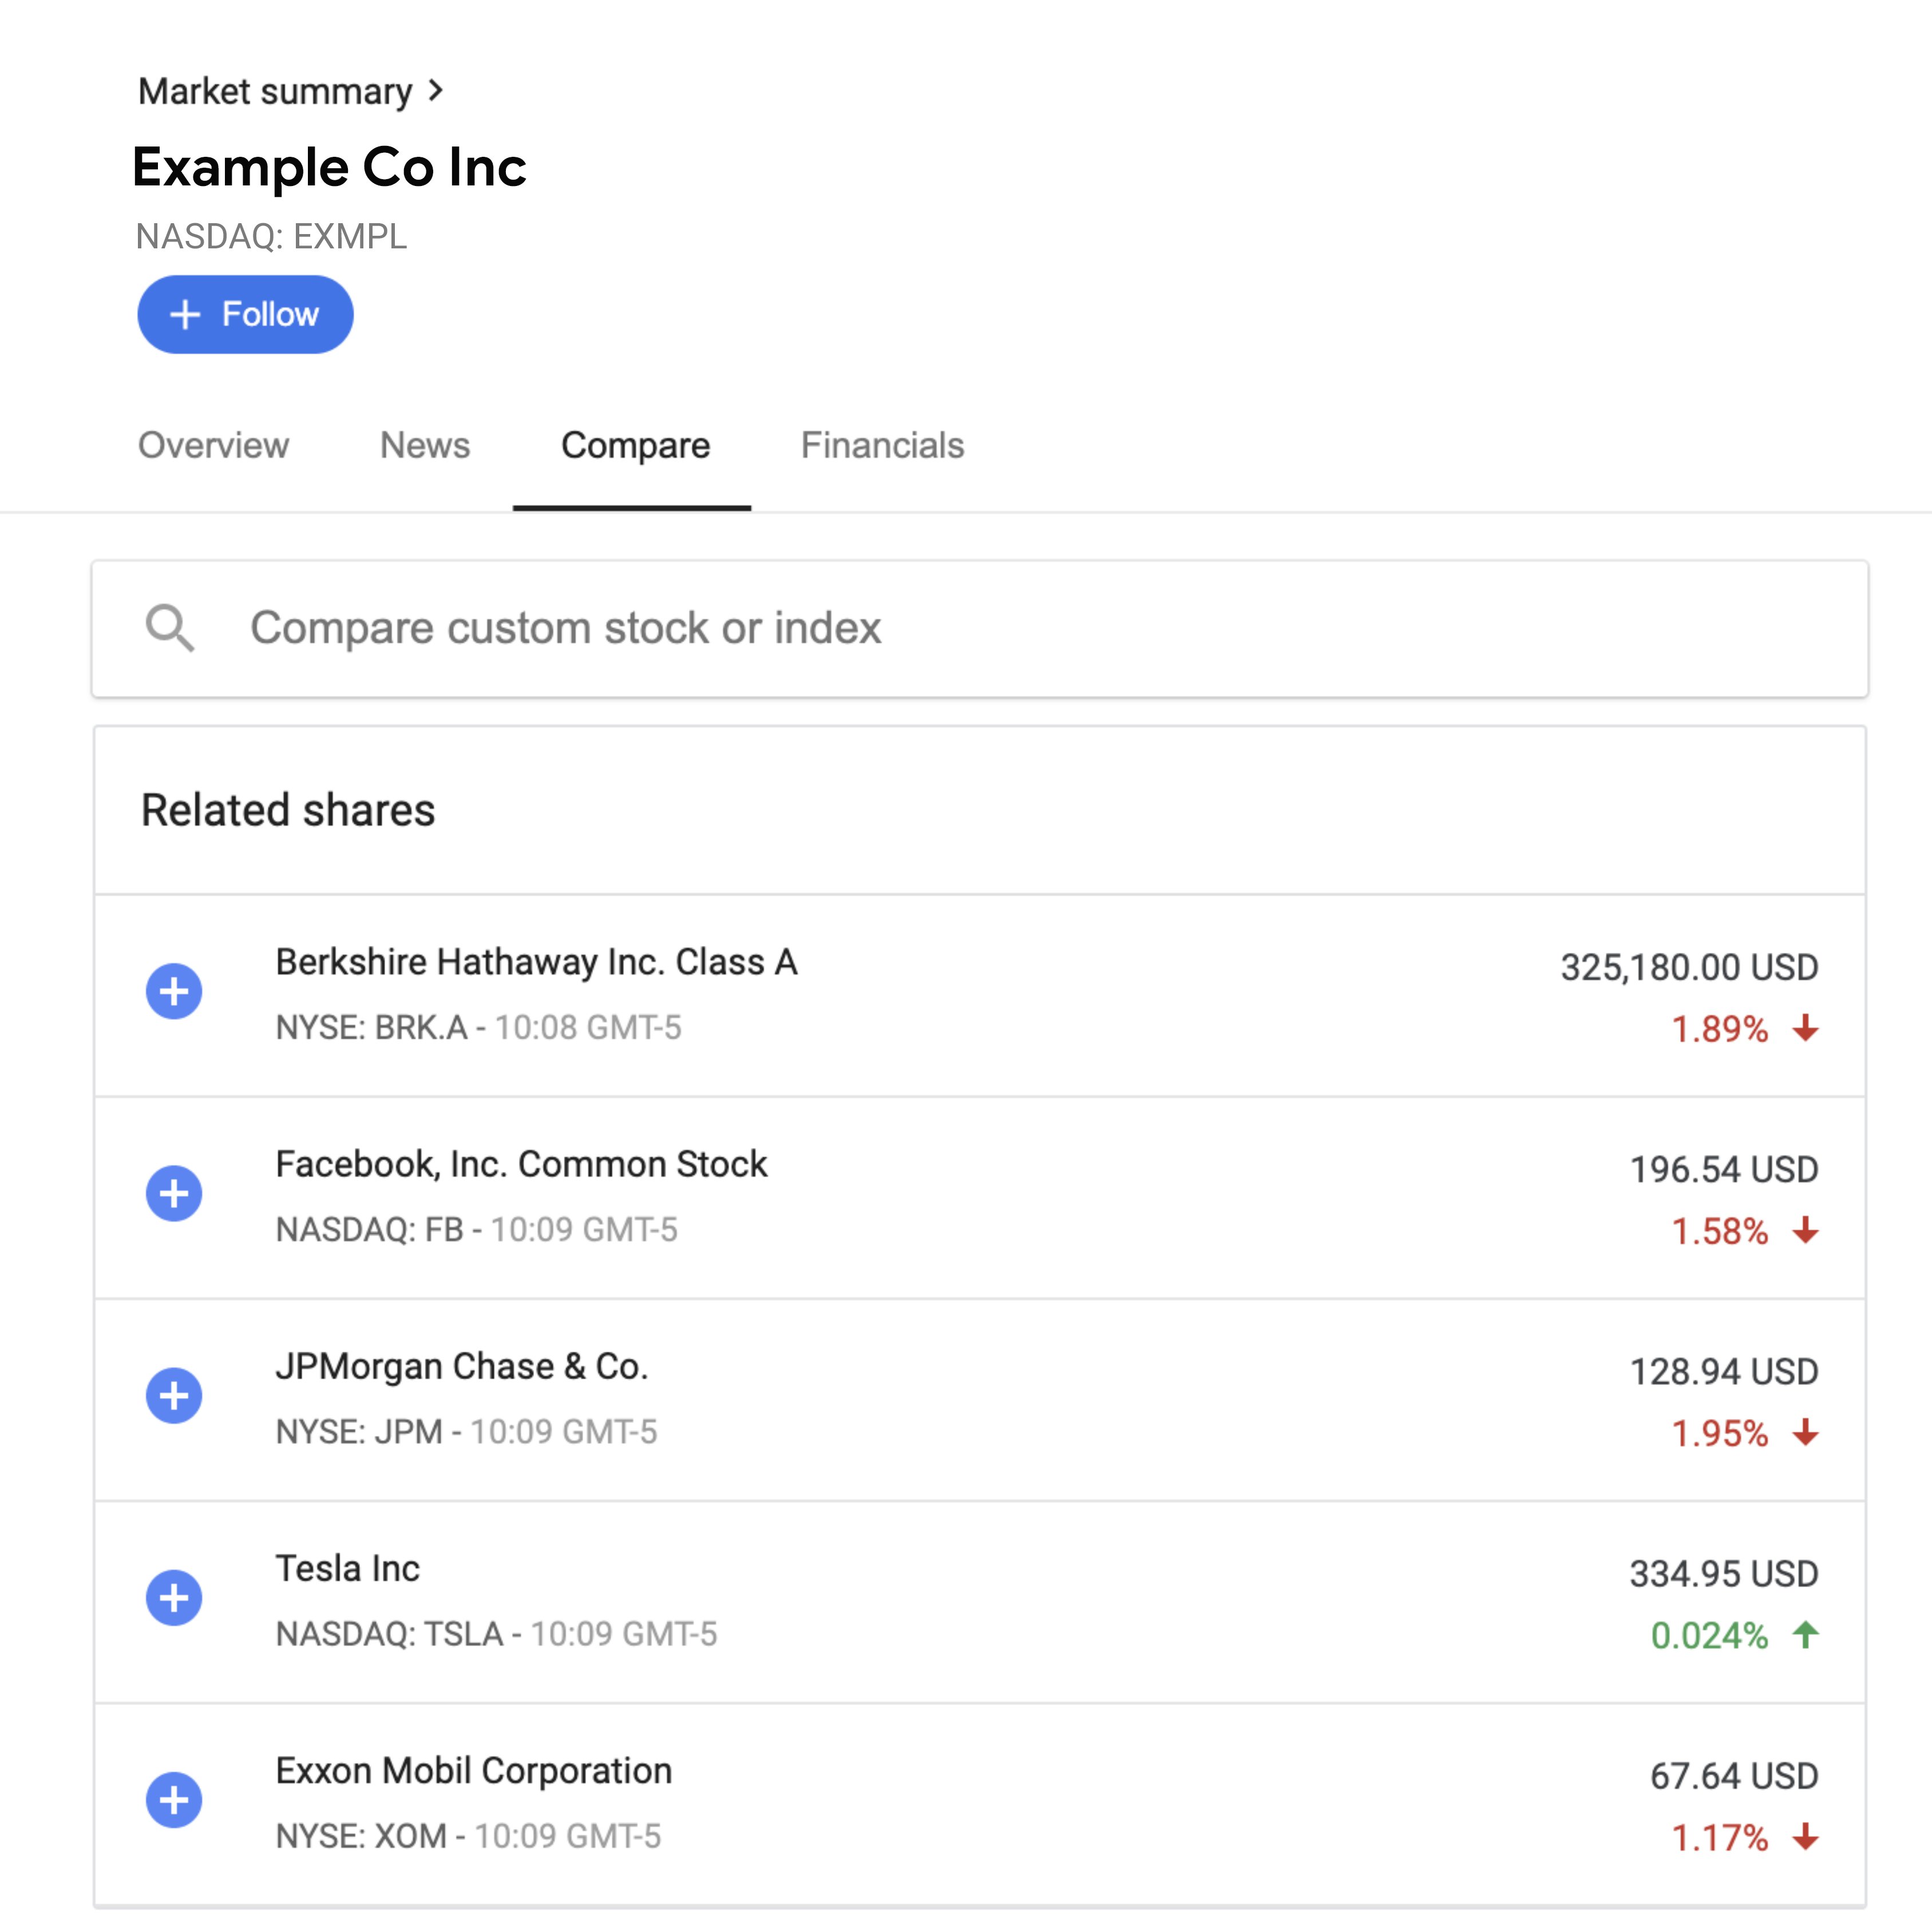
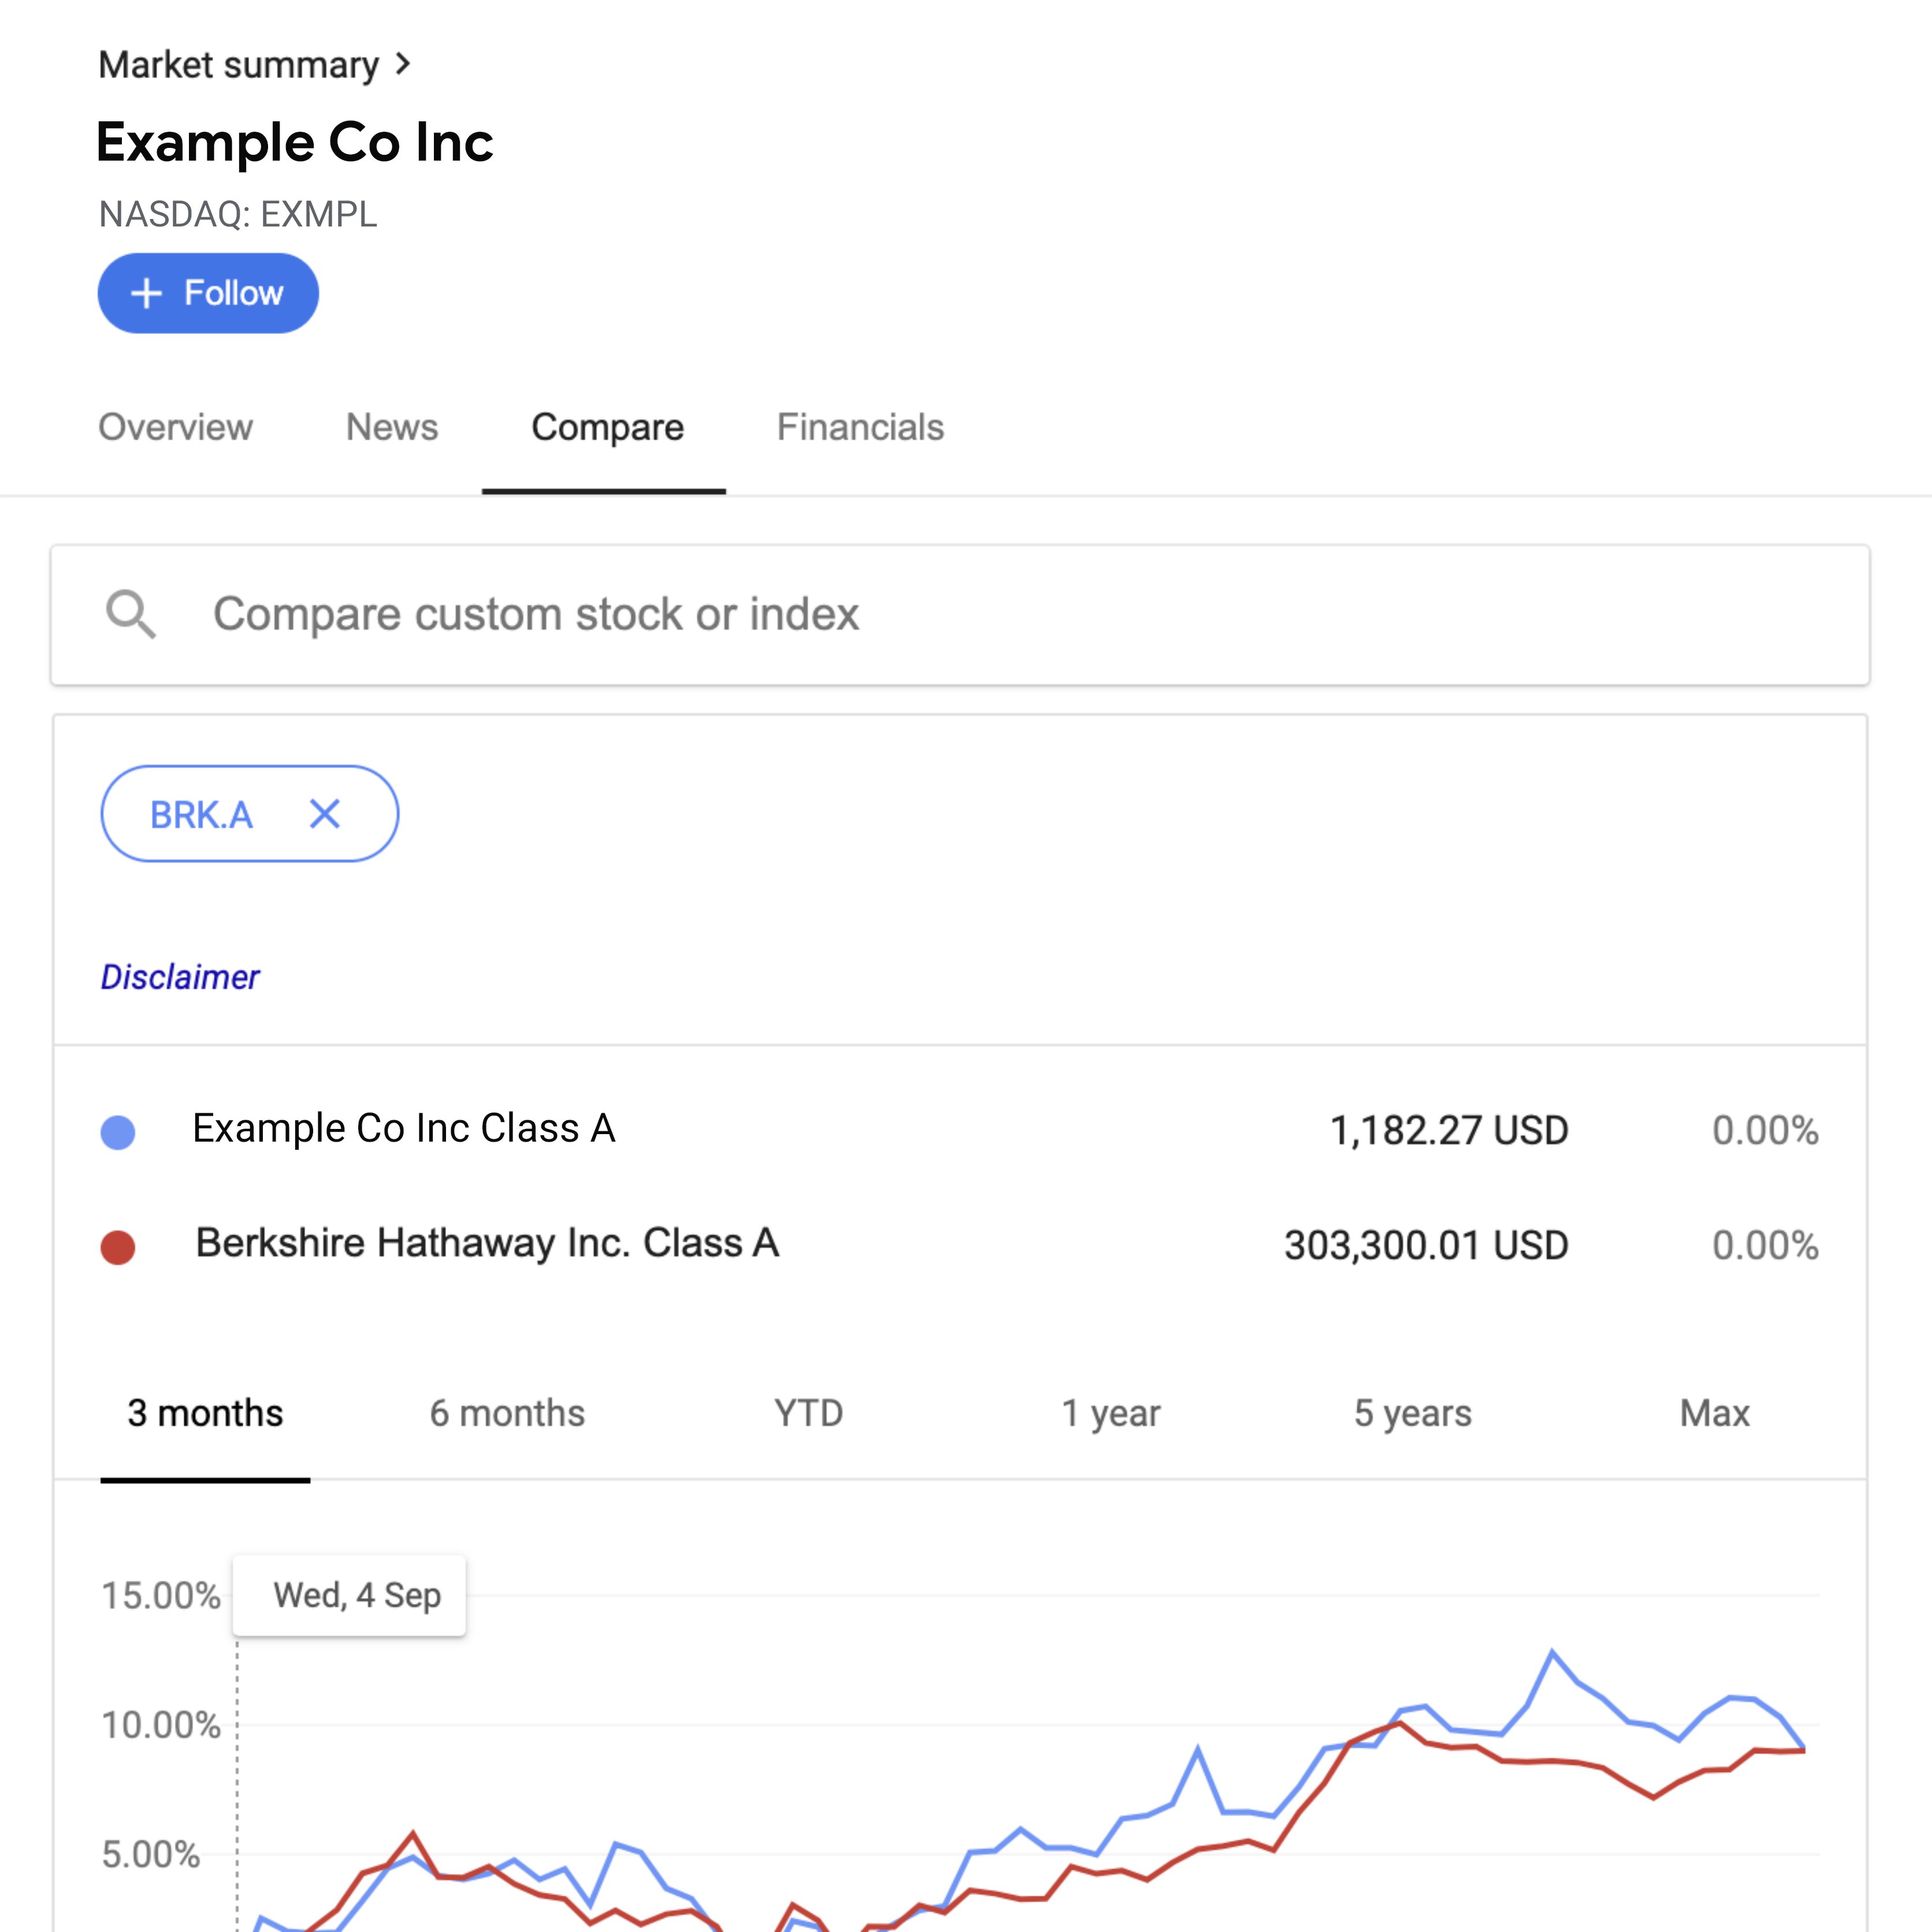
To compare the performance of any two stocks, first click Compare.
Now, find the stock you want to compare and click the + symbol next to it. This will create an instant chart comparing the performance of the two stocks’ prices.
Congratulations!
You completed “Google Finance: Research company performance.”
To continue building your digital journalism skills and work toward Google News Initiative certification, go to our Training Center website and take another lesson.
-
![GoogleNewsArchive_AccessThePast]()
Google News Archive: Access the past.
LessonDiscover historical digital publications and scanned newspapers. -
![GoogleMyMaps_ShowWhereStoriesHappen]()
Google My Maps: Show where stories happen.
LessonGive important context by building interactive maps. -
![image27_1_m4XKLu5.png]()
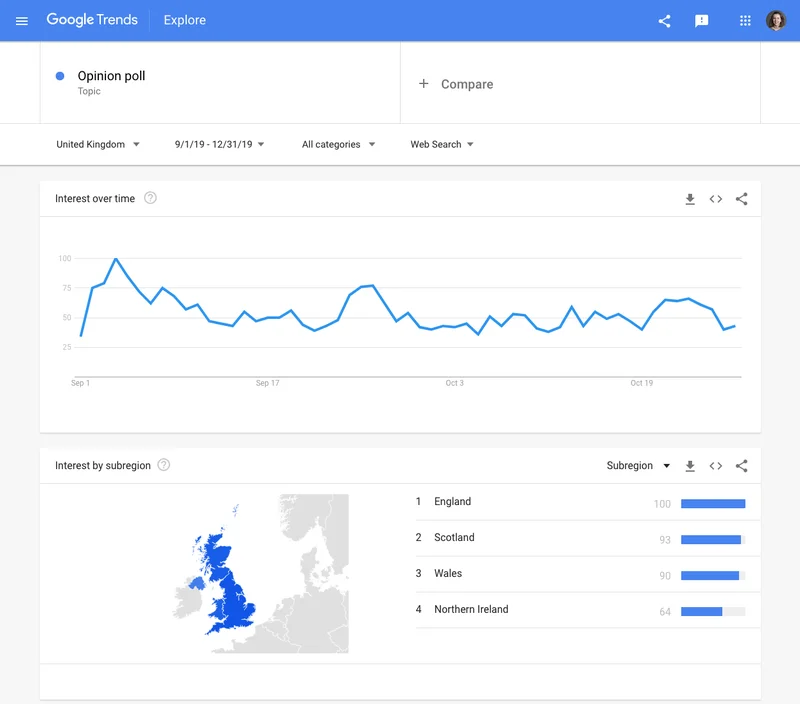
Covering politics with Google Trends
LessonIn this module, we will look at ways to use Google Trends to analyze searches specifically related to politics.