Global Fishing Watch: Monitor fishing fleets and vessels

A guide to using Global Fishing Watch’s mapping tool to track global fishing activity.
Lesson overview
Introduction to Global Fishing Watch.
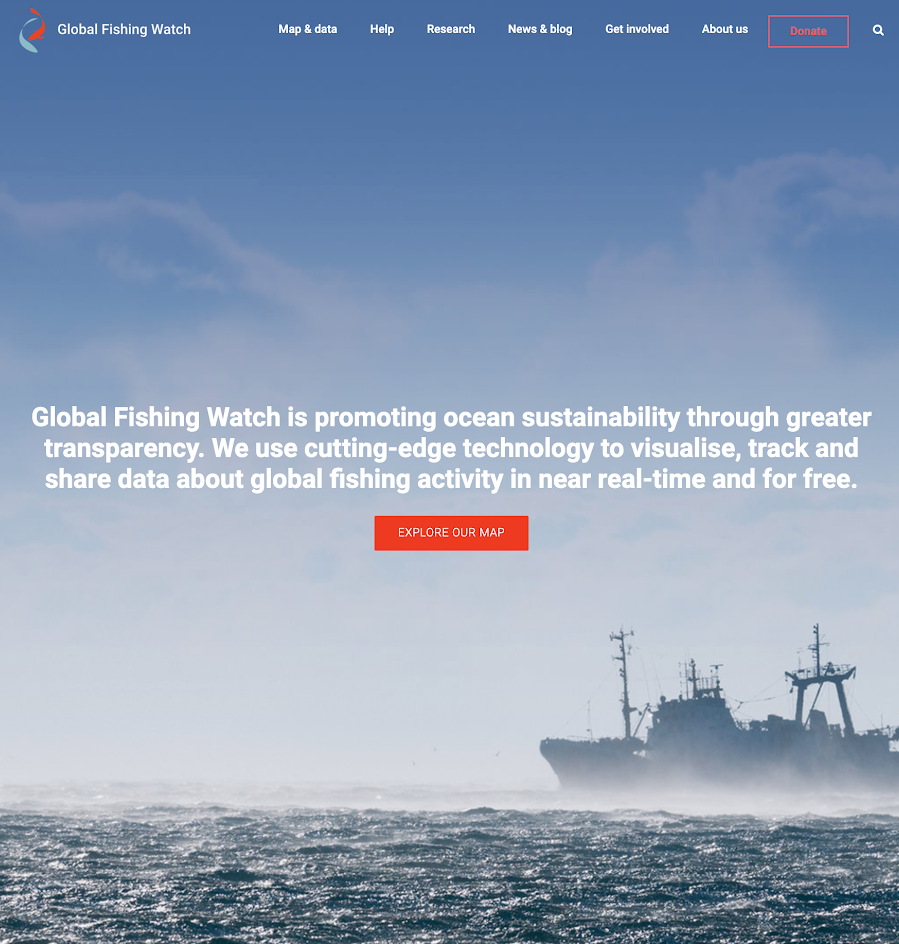
Global Fishing Watch was born out of a collaboration between Oceana, Skytruth and Google to provide the world’s first open-access view of commercial fishing. It has since spun-off as an independent non-profit and continues to strive for sustainable management via increased transparency in fisheries.
- Join Global Fishing Watch
- Explore Global Fishing Watch Map
- Global Fishing Watch Tool box
- Searching in Global Fishing Watch
- Understanding AIS and VMS data
For more Environmental Journalism lessons, visit:
newsinitiative.withgoogle.com/training/course/environmental-journalism
Join Global Fishing Watch
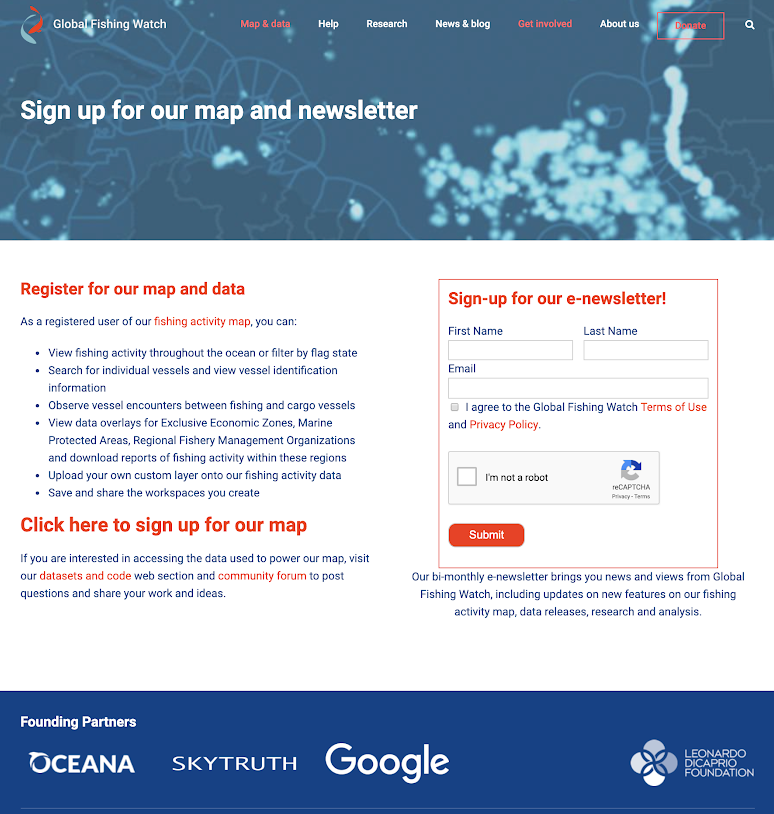
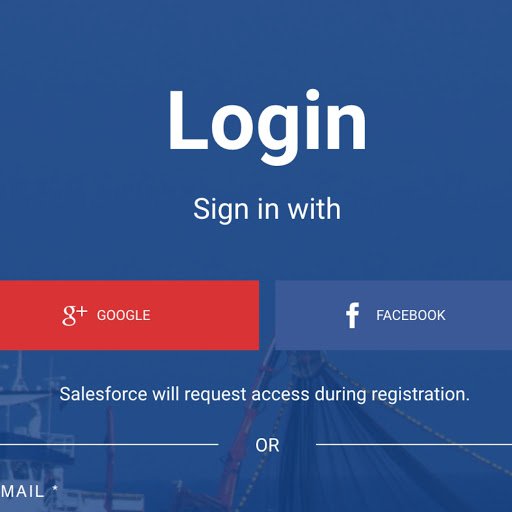
In order to access the more advanced features of Global Fishing Watch such as tracking vessels and creating custom fleets, you first have to sign up for access to the tool.
Visit globalfishingwatch.org/join to register for a Global Fishing Watch account. You can use your Gmail account or create an account and password with your email address.
Explore Global Fishing Watch’s Map
The interactive map allows you to track the global fishing effort in real time around the world. The map does this by capturing the location information from different maritime systems to paint a picture of commercial fishing from a global point of view.
Once you have registered you can access Global Fishing Watch’s map which tracks commercial fishing in near real time around the world.
The standard features are on the left side of the map. These allow you to zoom, share as a link or embed and measure distances on the map.
The time slider at the bottom of the map determines the time period over which fishing activity is displayed. Select start and end dates from the calendar, dating back to January 1, 2012, and up to near real-time. Or - Click on the bars on the left or right edge of the time slider, hold and drag to change the start or end time. Or- Click on the gear icon in the upper left corner of the highlighted time frame within the time slider to adjust the time frame you are interested in.
The toolbox on the top right is your control center for the data displayed on the map.
To select a specific vessel from the fishing activity displayed on the map: Click on fishing effort to open vessel identity in the toolbox and track the vessel. Where there are multiple vessels in close proximity, you may need to zoom in.
Global Fishing Watch Toolbox
The Global Fishing Watch Toolbox allows you to interact with the data collected on all of the world’s fishing vessels. From here you can track individual boats, countries or create custom fleets of trawlers.
If you click on the Vessels tab in the top right it will open the search tab where you can search for any given vessel.
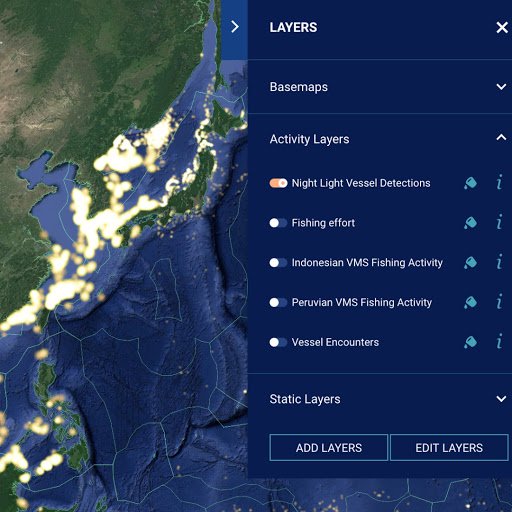
Clicking on layers gives you the option of: Changing Basemaps, which relate to the appearance of the map. Changing the activity layer alters the kind of information displayed. Finally you can edit static layers, like Exclusive Economic zone or Marine Preservation Areas, overlayed, or edit the basemap.
To select a specific vessel from the fishing activity displayed on the map: Click on ‘fishing effort’ to open vessel identity in the toolbox and track the vessel. This may require zooming in where there are multiple vessels in close proximity.
What does Global Fishing Watch mean by “fishing effort”? They analyze data about a vessel’s identity, type, location, speed and direction, and apply a fishing detection algorithm to determine “apparent fishing activity” based on changes in vessel speed and direction. The algorithm classifies each broadcast data point for these vessels as either apparently fishing or not fishing and shows the former on our public mapping platform.
Searching in Global Fishing Watch
Introduction to finding specific vessels and creating custom fleets in the Global Fishing Watch map.
Log into your Global Fishing Watch account.
Click on the Vessels tab in the toolbox and enter the vessel identity information (vessel name, MMSI number, IMO number and callsign) in the search bar. Make sure that the activity layer you are searching the vessel in is active. If not, you will not see any results.
The custom fleet feature lets you select and group a set of pinned vessels with the objective of seeing them move as a fleet in the map (represented with the same color). First, search for or select the vessels you are interested in grouping as a fleet. Pin all vessels. You should see all pinned vessels under the vessels tab.
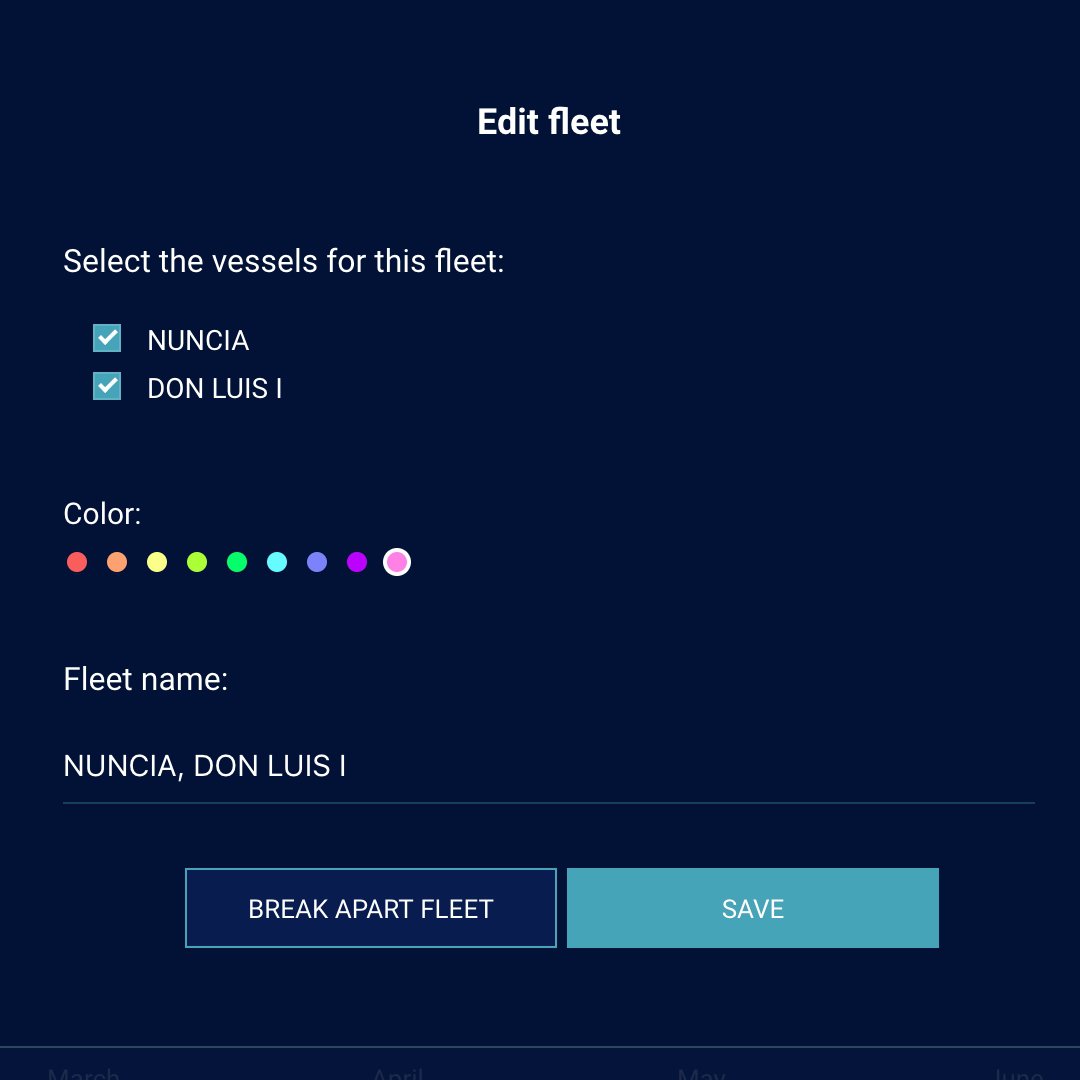
Click the `Create Fleet` button. Select the checkboxes of all vessels you want to include in the fleet. Customize the fleet name and color.
In case you want to remove the fleet you have created, click on the fleet edit button and then `Break Apart Fleet`.
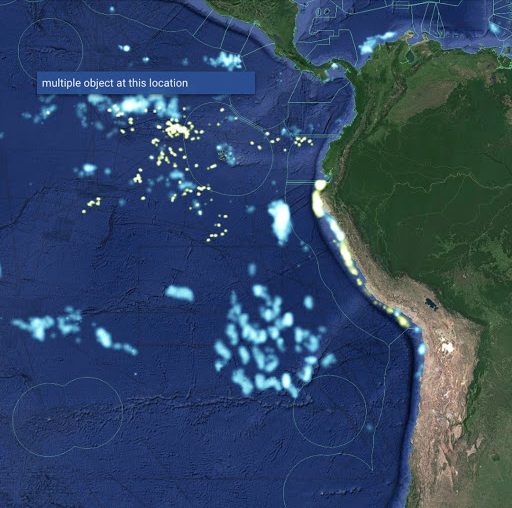
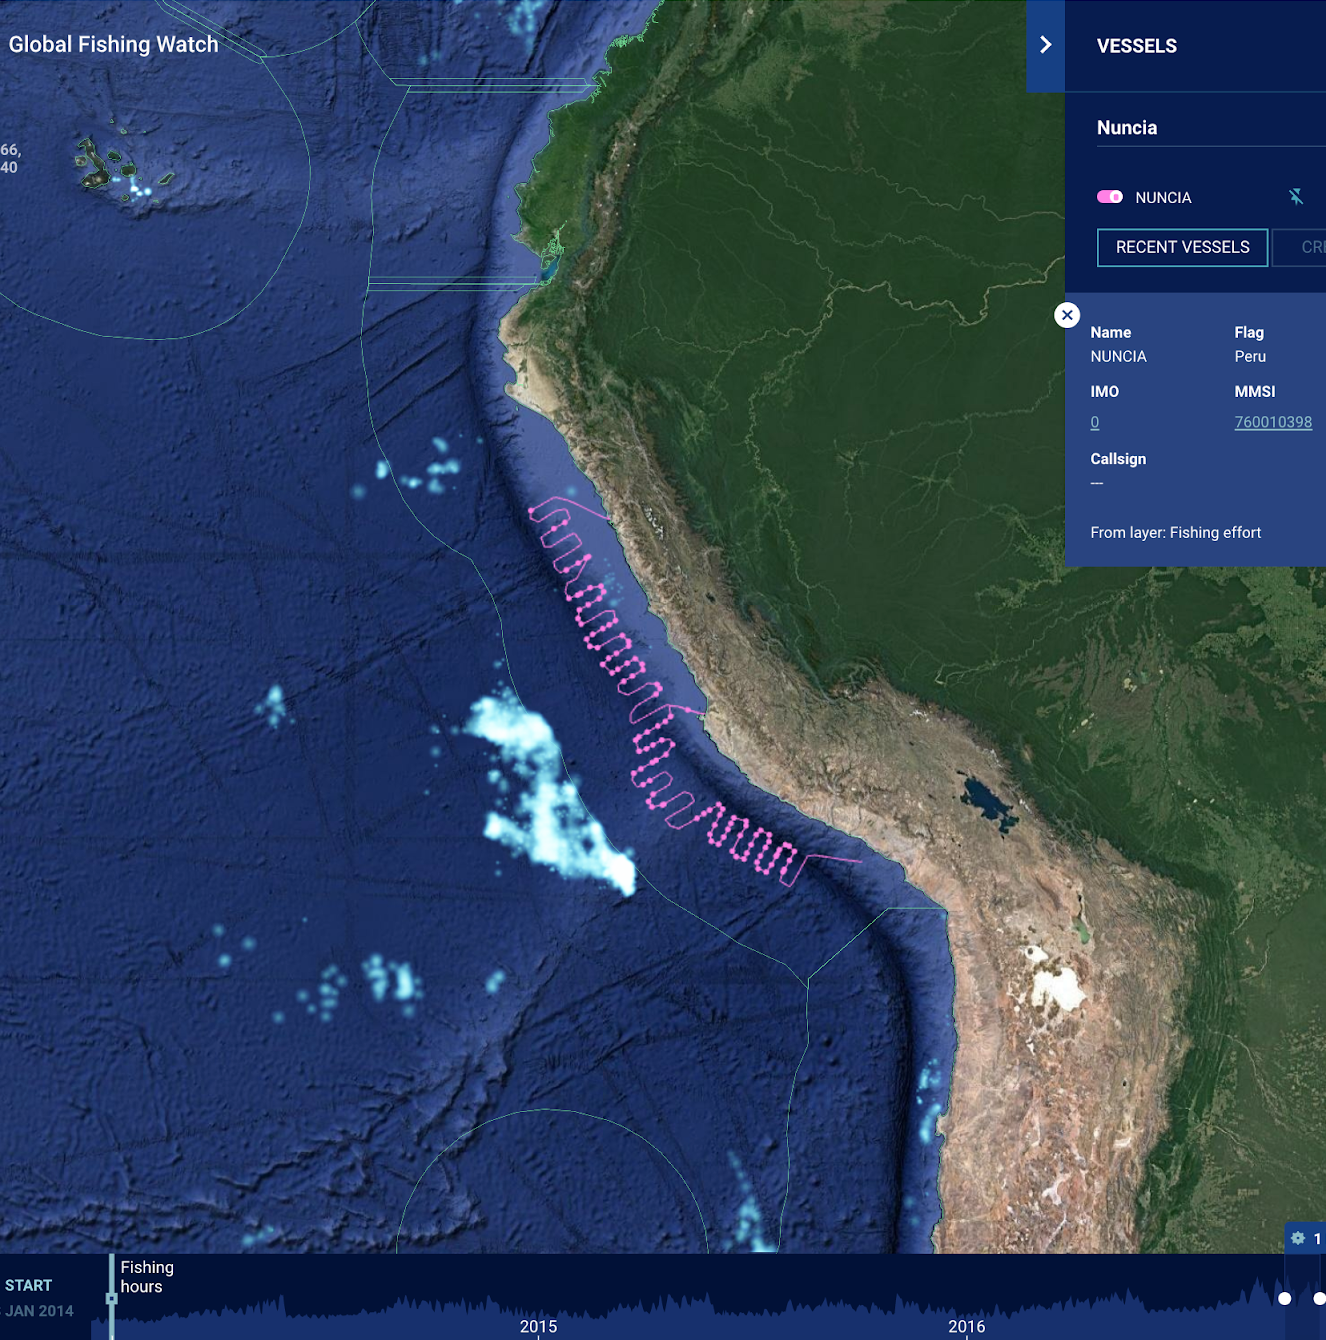
Let’s review with an example: Search for ‘Nuncia.’
Select your vessel. Sometimes there are multiple vessels with the same name, so you may need to know additional identity information to find the correct info. In this case, we’re looking for MMSI 760010398.
Clicking the compass icon will adjust the map viewport and time slider to fit the vessel tracks. To change the color of a vessel track, click on the paint can icon (appears once a vessel is pinned). To save this vessel, click the pin icon. Note that you can pin multiple vessels at once.
Click play on the timeline at the bottom to view the Nuncia’s fishing movements up and down the coast of South America.
Understanding fishing activity using AIS and VMS data
Introduction to the AIS and VMS activity layers in the Global Fishing Watch maps. AIS and VMS. AIS is a monitoring system or larger international fishing vessels while VMS focuses more on smaller ships fishing within national waters.
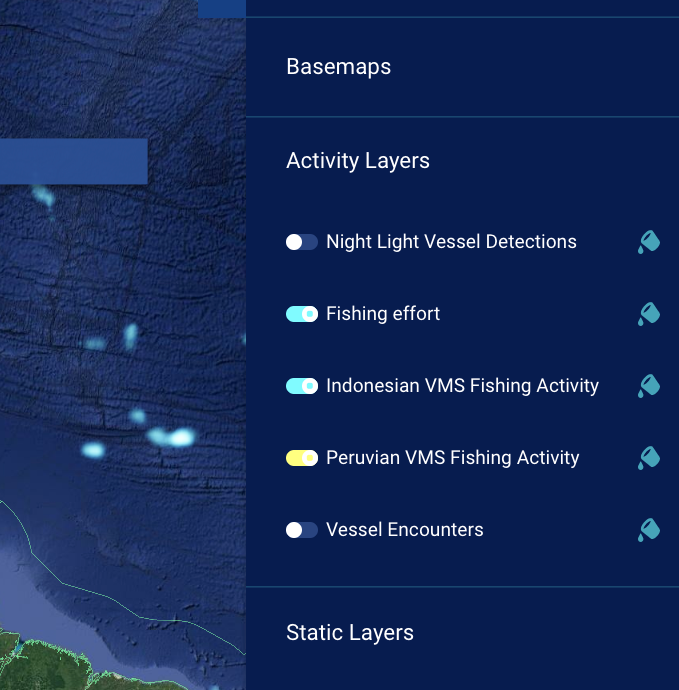
To view AIS data: Under ‘Layers’ in the toolbox, open ‘Activity Layers’ to view options for vessel activity to be displayed on the map. Fishing effort refers to AIS data.
To activate a layer, click on the toggle to the left of the layer. The toggle will appear colored once the layer is activated.
To change the color of the layer on the map, click the paint can, and to get more information about the layer, click the ‘i’ icon.
To search for VMS data: VMS data are also available under ‘Activity Layers’ and listed by country. The nature of VMS sharing means that the periodicity of each country’s data differs. Click the ‘i’ icon to learn more.
You will see that with some of the VMS data specific vessel identifiers have been redacted. This data can only be released publicly with the permission of the flag state.
Individual vessel tracks for AIS and VMS data can be compared by pinning the vessel under both layers: Turn ‘Fishing effort’ on and all other activity layers off. (A vessel search will only yield results from activity layers selected.)
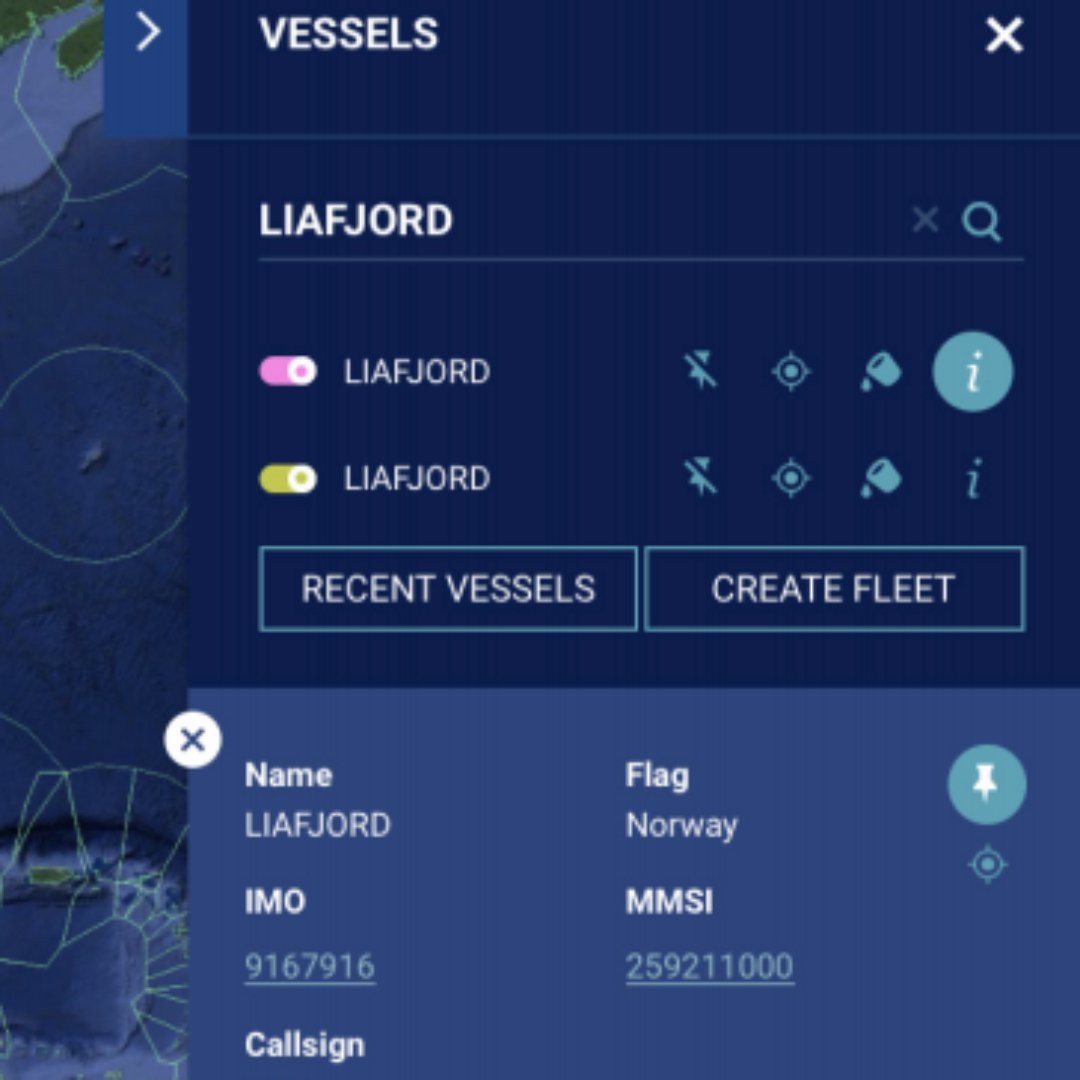
Open the Vessels tab and search for and pin Liafjord.
Open the ‘Layers’ tab again and turn ‘Peruvian VMS Fishing Activity’ on and all other activity layers off.
Open the Vessels tab again and search for and pin Liafjord.
Open the Activity Layers and deactivate Peruvian VMS data. This will provide a clearer view of the vessel tracks
In the Vessels tab, click the compass icon to center your map around the Liafjord’s activity.
Hit play on time slider to play the vessel tracks and AIS/VMS data. You can see the discrepancies in what the layers record.
Understanding VIIRS data
Learn to interpret VIIRS, or Visible Infrared Imaging Radiometer Suite, data in our map.
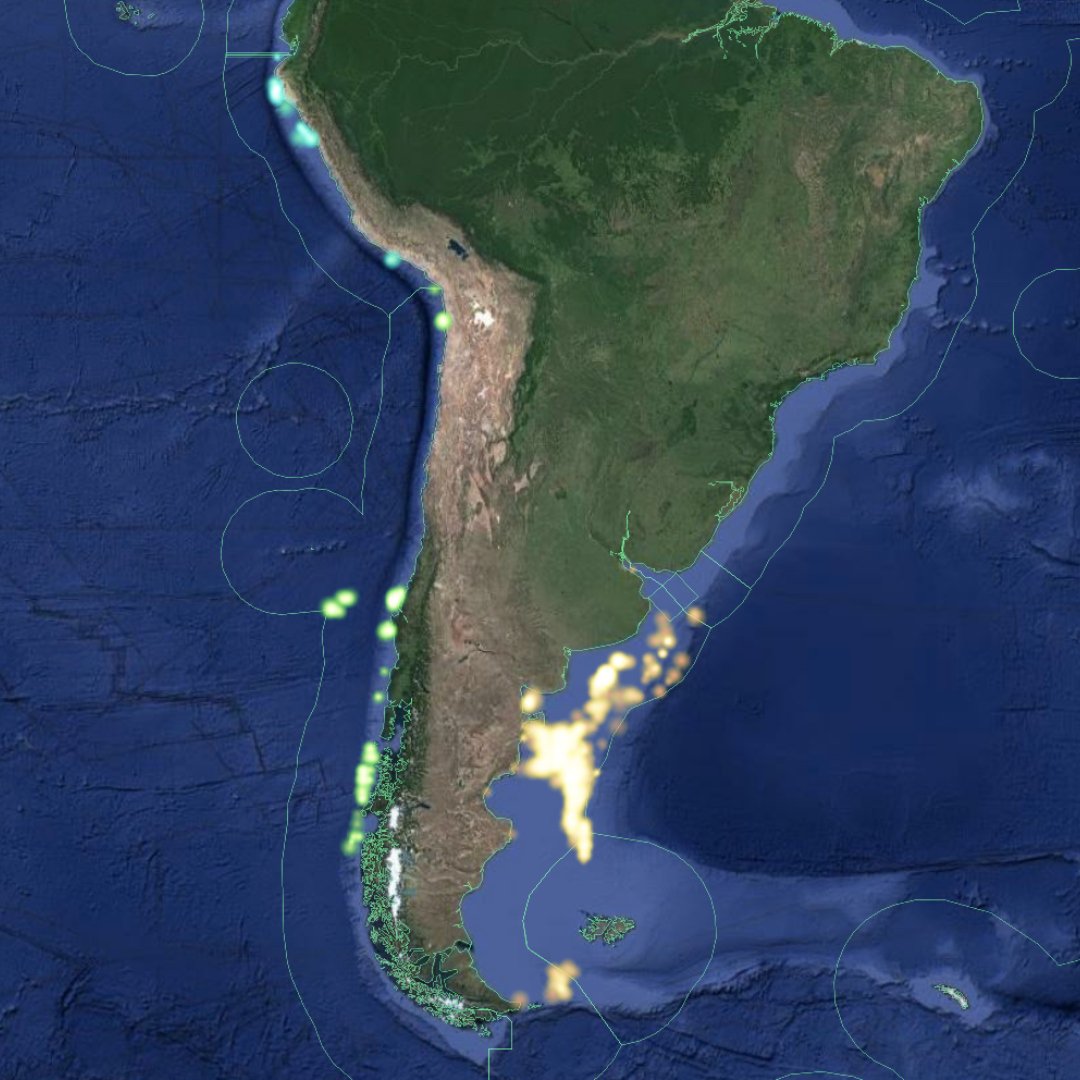
The VIIRS satellite sensor can identify bright lights at night. In the dark ocean, vessels using bright lights stand out to this sensor and can be tracked. Some forms of fishing, such as squid jigging, use bright lights at night and squid fleets can be easily seen in the VIIRS data.
Some fishing vessels are not required to use vessel tracking systems such as AIS. However, if they are fishing using lights, they will be detected by VIIRS. To find these, click on ‘Layers,” then ‘Activity Layers.’
Activate ‘Night Light Vessel Detections’ and ‘Fishing effort.’ Select a start date of January 1, 2017.
Zoom out to the global level and press play to view the difference between fishing activity detected in these two datasets.
Now select a start date of July 1, 2018. Zoom in on the Galapagos islands. Note that a group of vessels is detected only with VIIRS data and not AIS.
A few caveats are necessary for understanding these detections. One is that not all are actually fishing vessels - some may be other large vessels. Also, many vessels fish without lights, or with dim lights and would not show up in this dataset. Finally, there are false positives - places where the algorithm detects a light, but which result from errors or noise. There are also some cases of the algorithm picking up airplanes on international flights, although these are rare.
Downloading Reports
Learn how to create a downloadable report of fishing activity.
First, you must be logged into your Global Fishing Watch account to create a report of fishing activity.
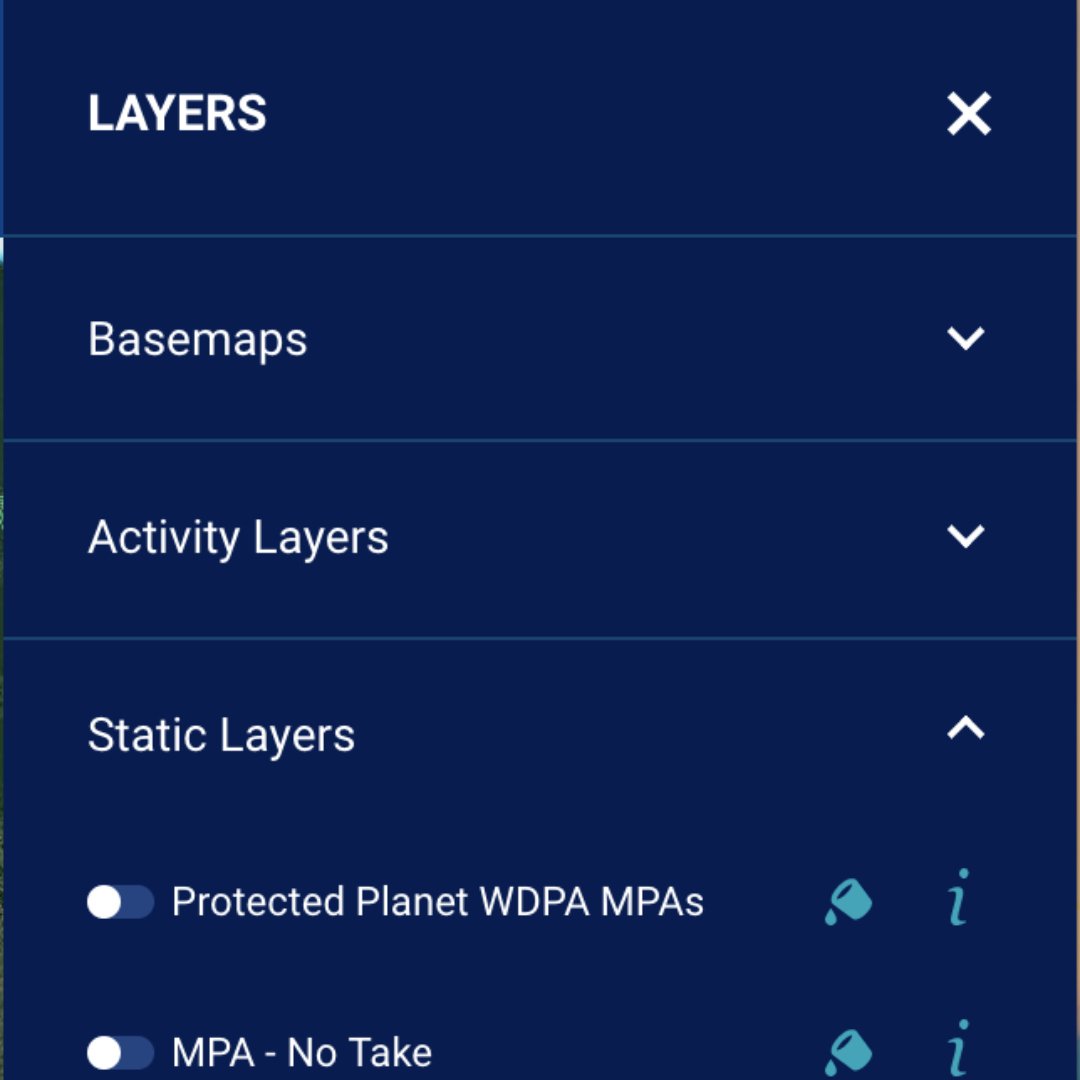
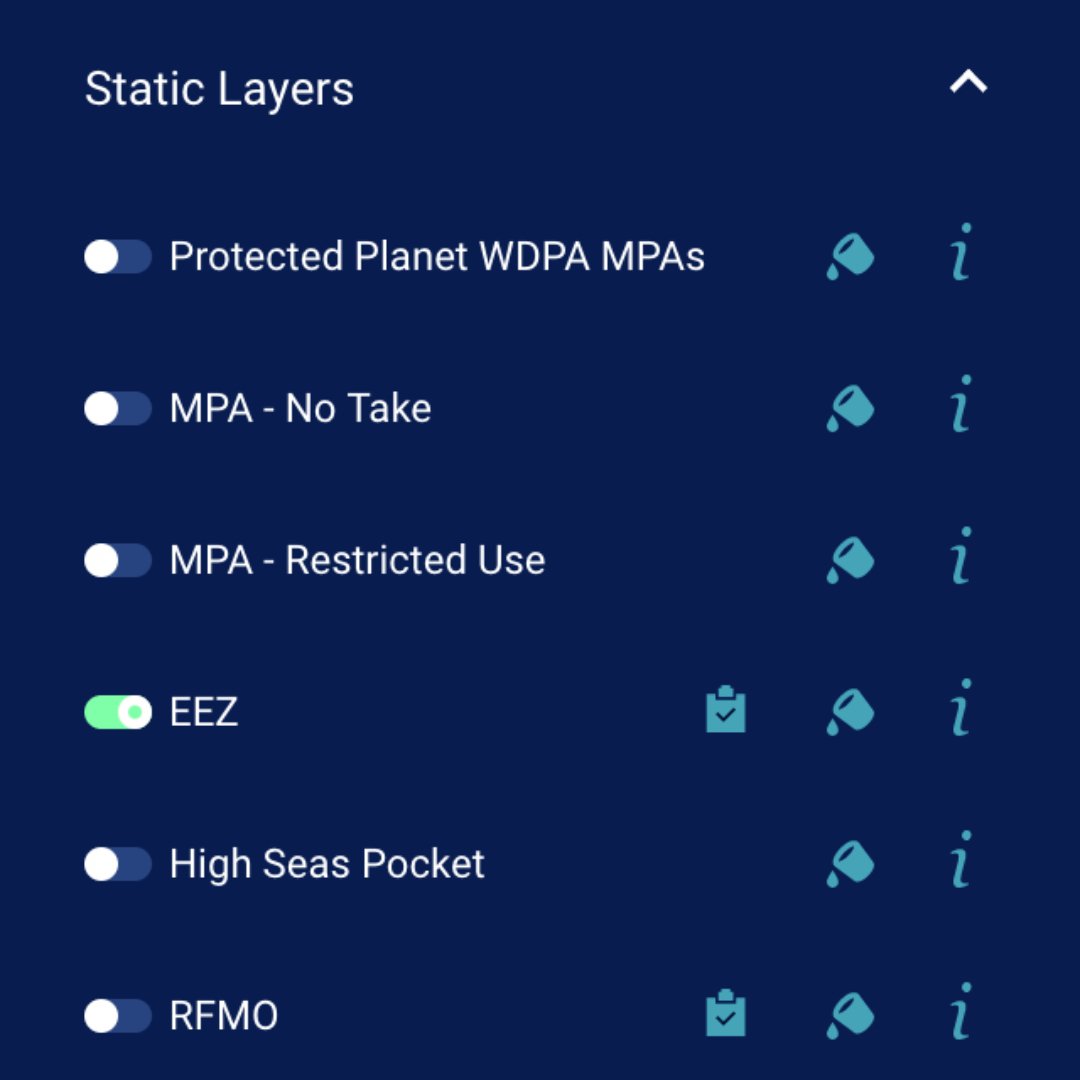
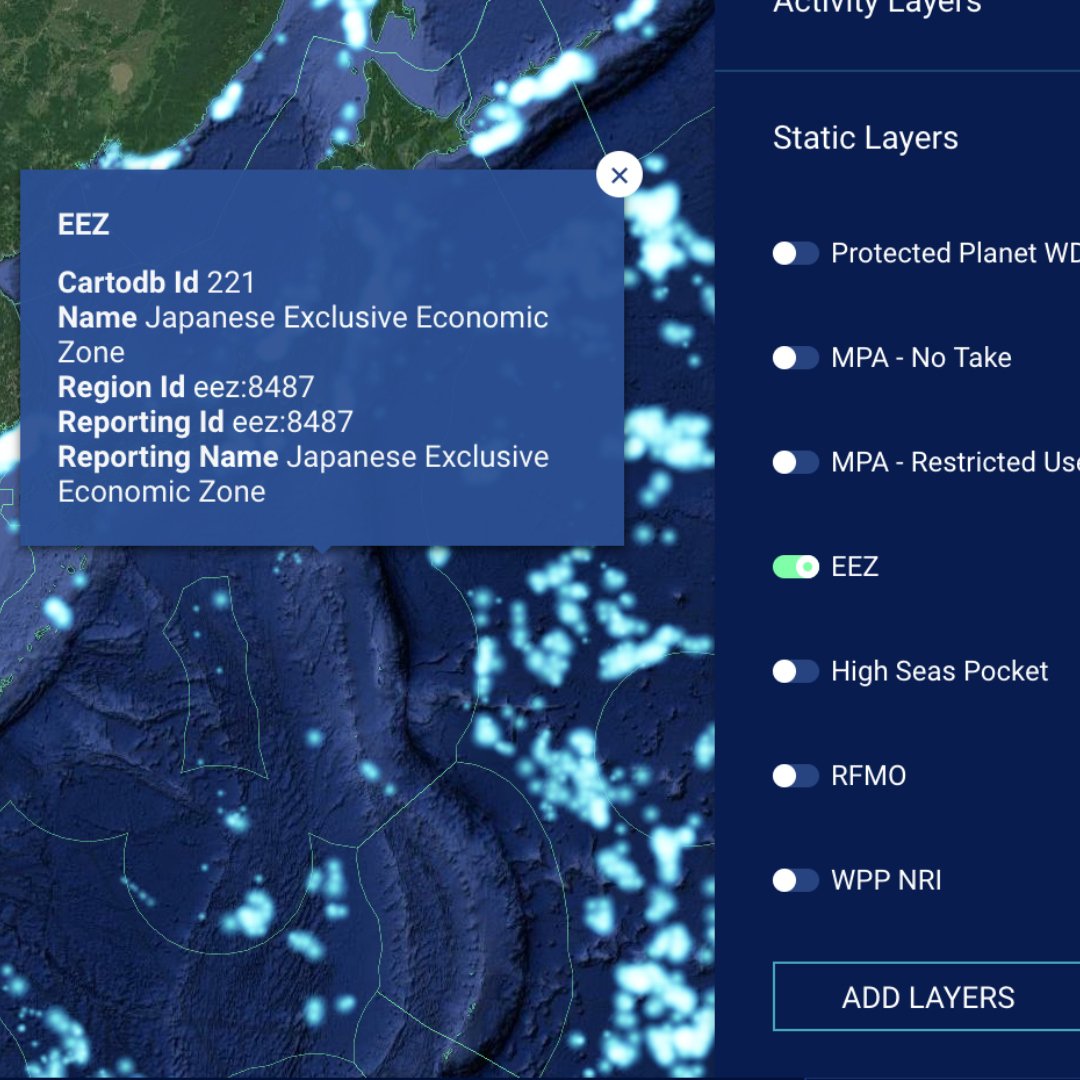
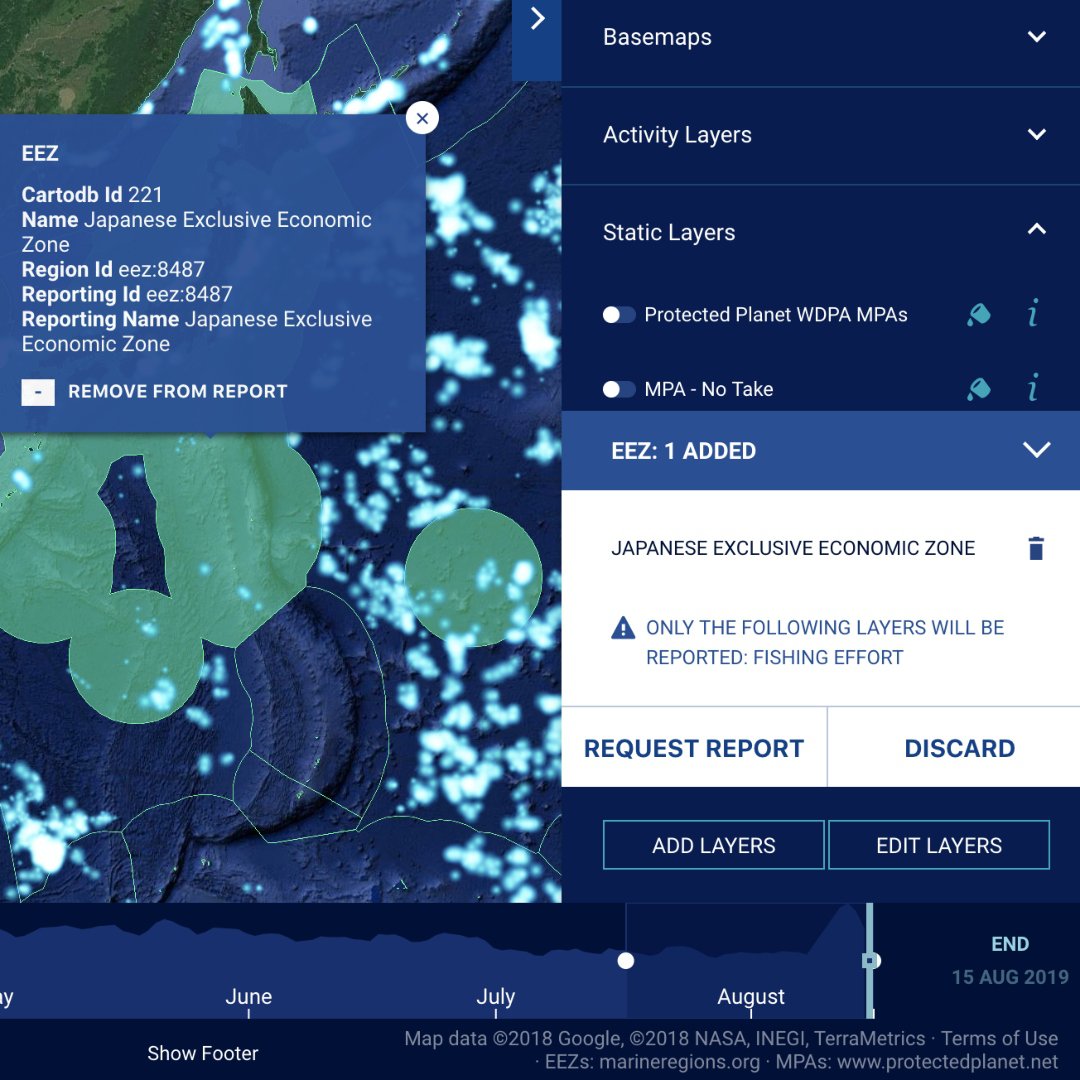
In the map toolbox, open the ‘Layers’ tab, then on ‘Static Layers.’
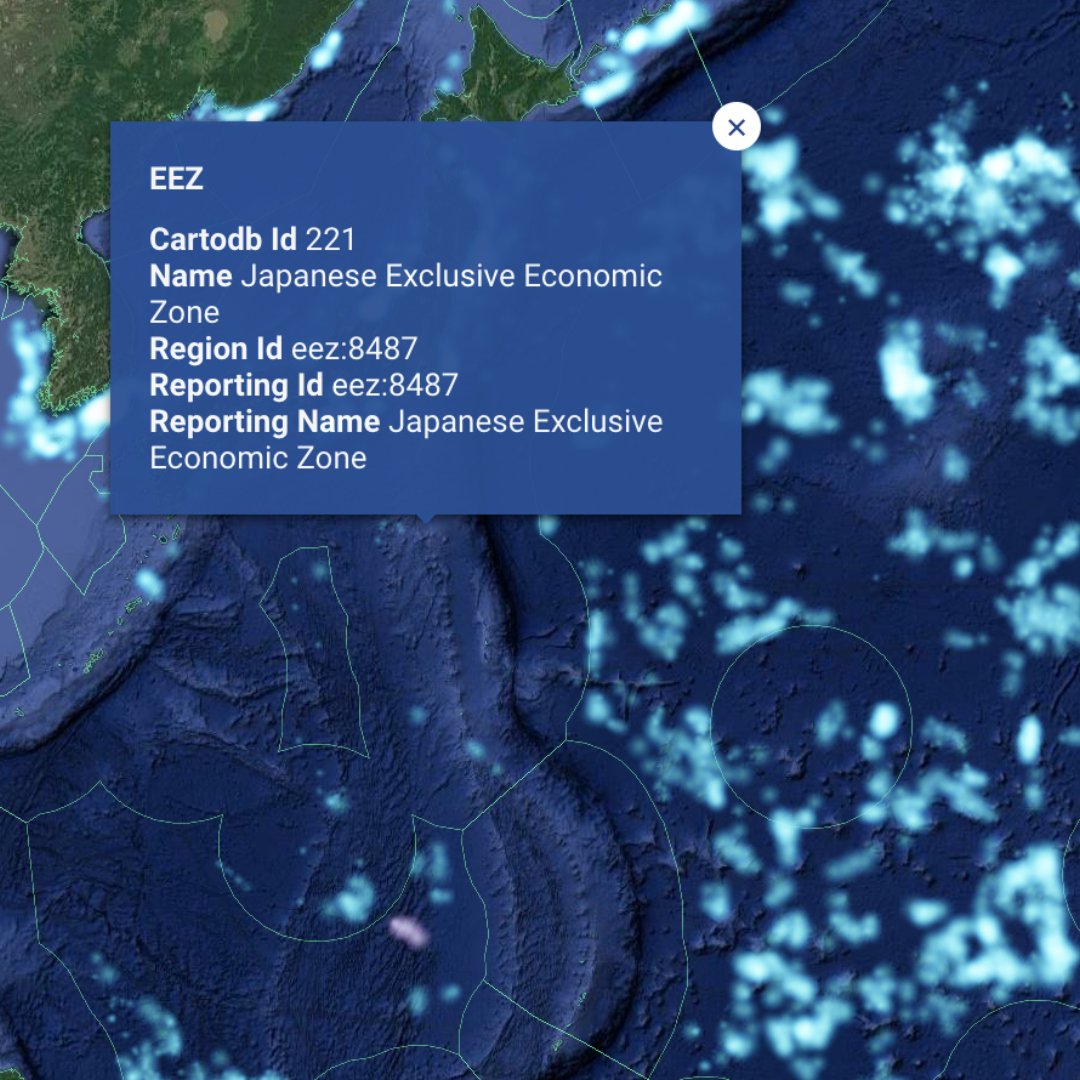
Click the report icon (closest icon to the layer name) for the layer you are interested in observing Exclusive Economic Zone (EEZ) or Regional Fisheries Management Organisations (RFMO). The report icon will turn white when selected.
Click within the area you are interested in (e.g. within the EEZ or RFMO).
A pop-up box will appear with the name of the area you have selected. Click ‘Add to report’. You may select multiple regions.
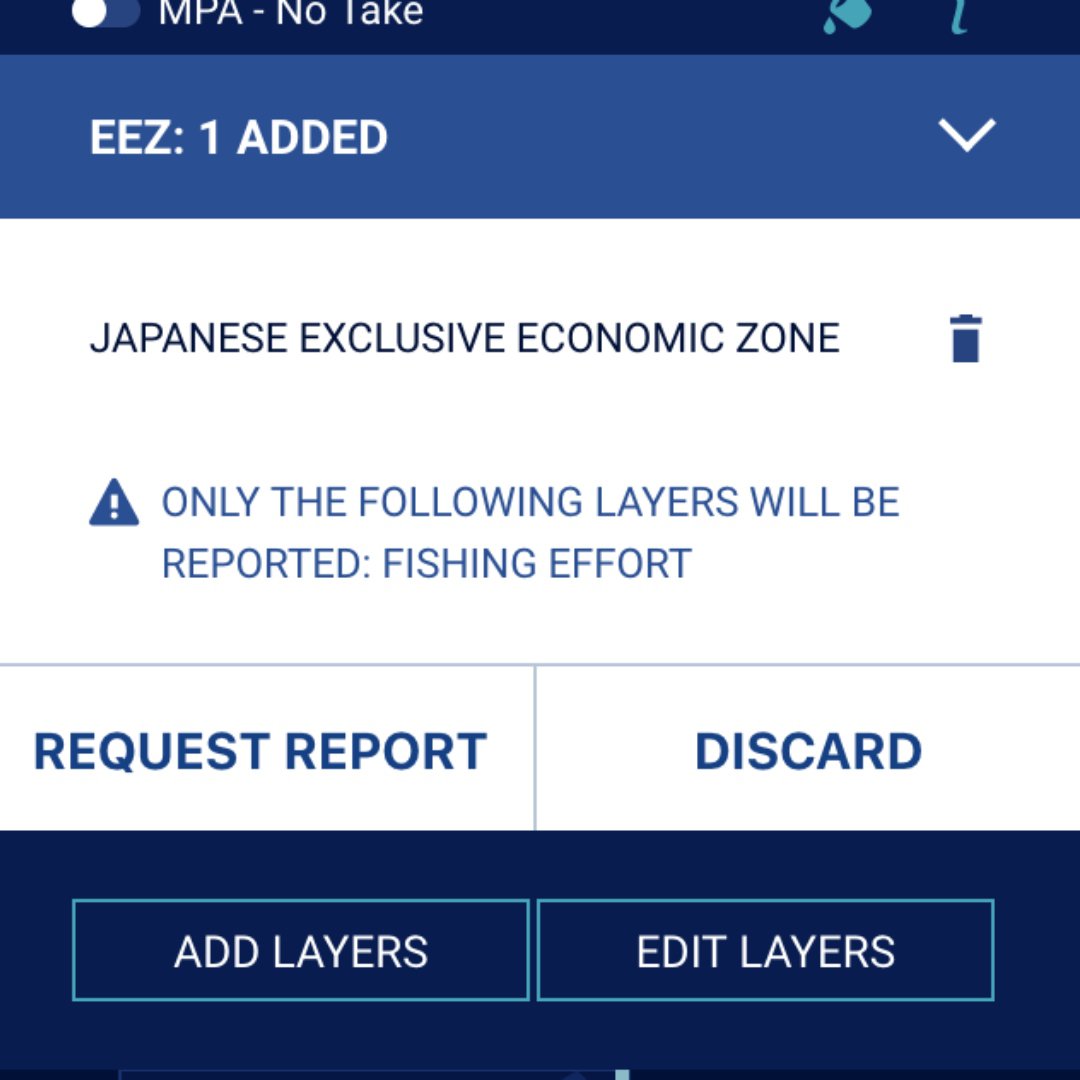
In the toolbox, click ‘Request Report.’
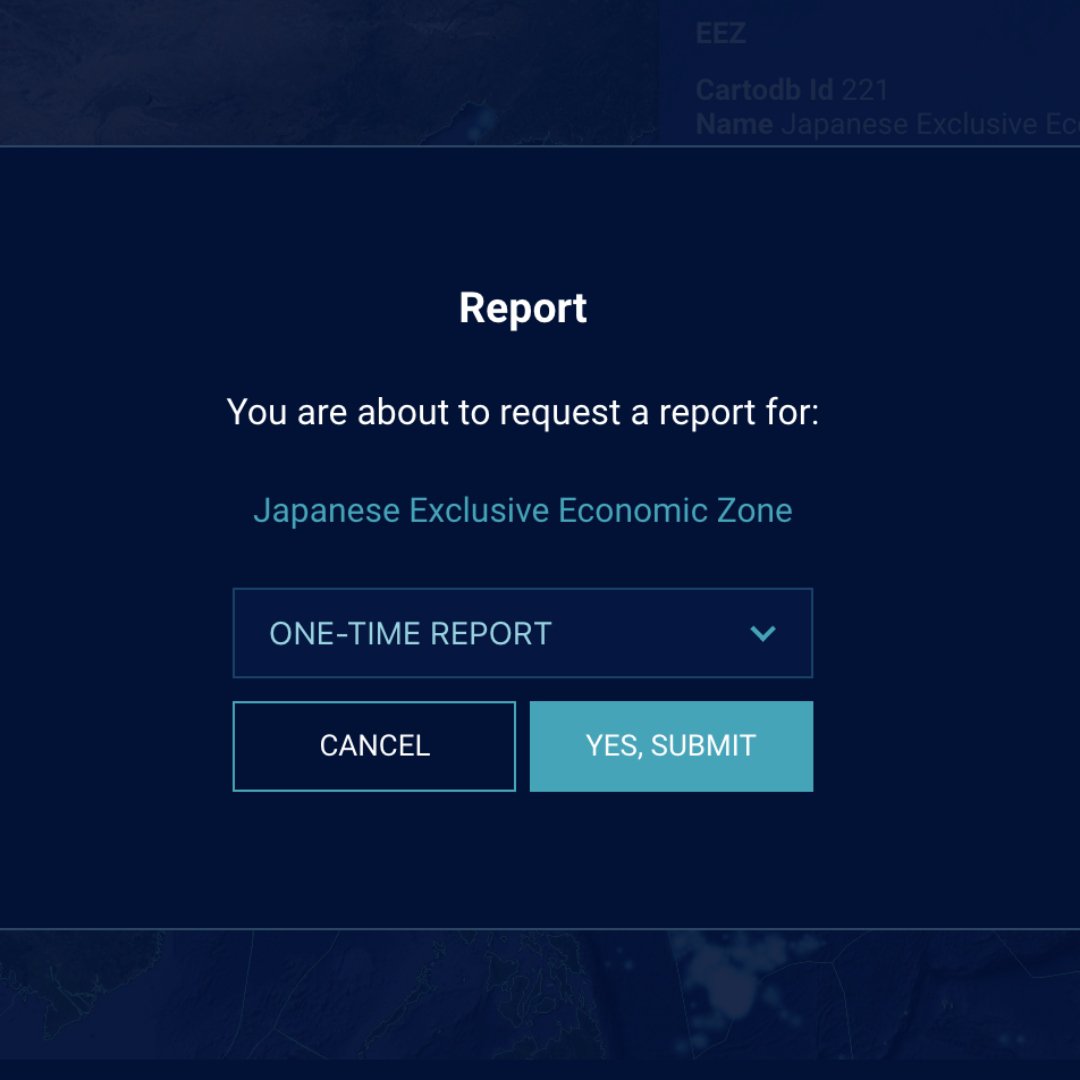
Select the frequency at which you would like to receive reports for the area.
The report will be emailed to you as an attached file in a few minutes.
Filtering Fishing Activity
Learn how to filter fishing activity by flag state or gear type.
To filter by flag state, first click ‘Layers,’ then ‘Activity Layers’.
Activate ‘Fishing effort.’
Click on ‘Filters.’
Click ‘Create filter.’
Select ‘fishing effort.’
Select Argentina under ‘Country.’
Click ‘Save.’
Scroll around Argentina to view fishing activity from Argentine vessels. Click play to view Argentine fishing effort over time.
To compare Argentina’s fishing effort with another country’s, repeat steps 3-4 for that country. Repeat steps 3-4 with Peru and Chile.
Select a different color for each flag state.
Press play to view fishing activity of these three flag states
Congratulations!
You completed “Global Fishing Watch: Monitor fishing fleets and vessels.”
To continue building your digital journalism skills and work toward Google News Initiative certification, go to our Training Center website and take another lesson:
For more Environmental Journalism lessons, visit:
newsinitiative.withgoogle.com/training/course/environmental-journalism
-
![DataStudio_MakeInteractiveDataVisualizations]()
Data Studio: Make interactive data visualizations
LessonGive life to your datasets by creating powerful interactive visualizations with an easy-to-use studio. -
![gni_business_lesson_play_6]()
Learn more about your audience with surveys
LessonUnderstand your audience, their habits, and what they value with surveys -
![GO801_GNI_PasswordAlert_Title_Card_1.jpg]()
Password Alert: Protect yourself from password theft.
LessonThis simple Chrome extension is your first line of defense.