Not sure where to start? Take a short quiz to get personalized recommendations.

Business Reporting

4 lessons
20 minutes
beginner
Build your digital skills on Google Sheets and learn how to identify and report on financial news stories with the help of visualisation tools.
Download
Tools Used
GNI_Resources_Business_reporting1_270x270.png
0%

Lessons

You might also like:
Filters
Sort by:
  • Featured
  • Newest to Oldest
  • Oldest to Newest
Filters
You might also like:
Sort by:
  • Featured
  • Newest to Oldest
  • Oldest to Newest
google_finance_research_company_performance_lesson_overview.jpg

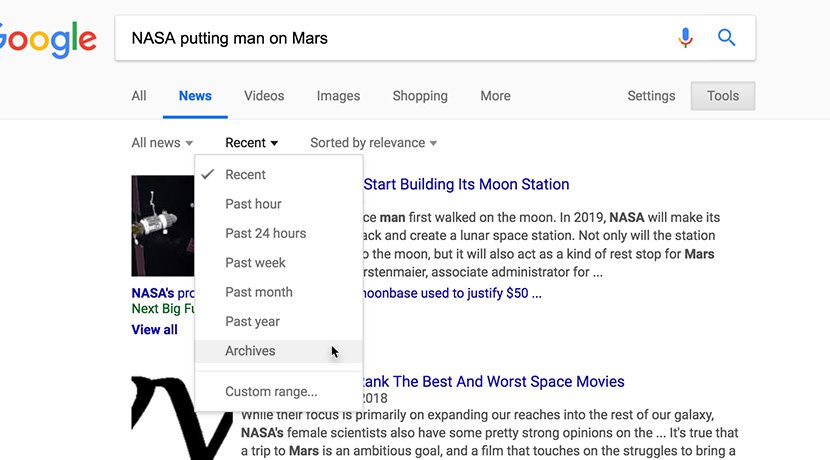
Google Finance: Research company performance

lesson 5 minutes Beginner
Google Finance allows you to track companies across 53 exchanges on five continents.
Google_Finance_Research_company_performance_access_the_data_in_google_sheets_step_84GSOoo.jpg

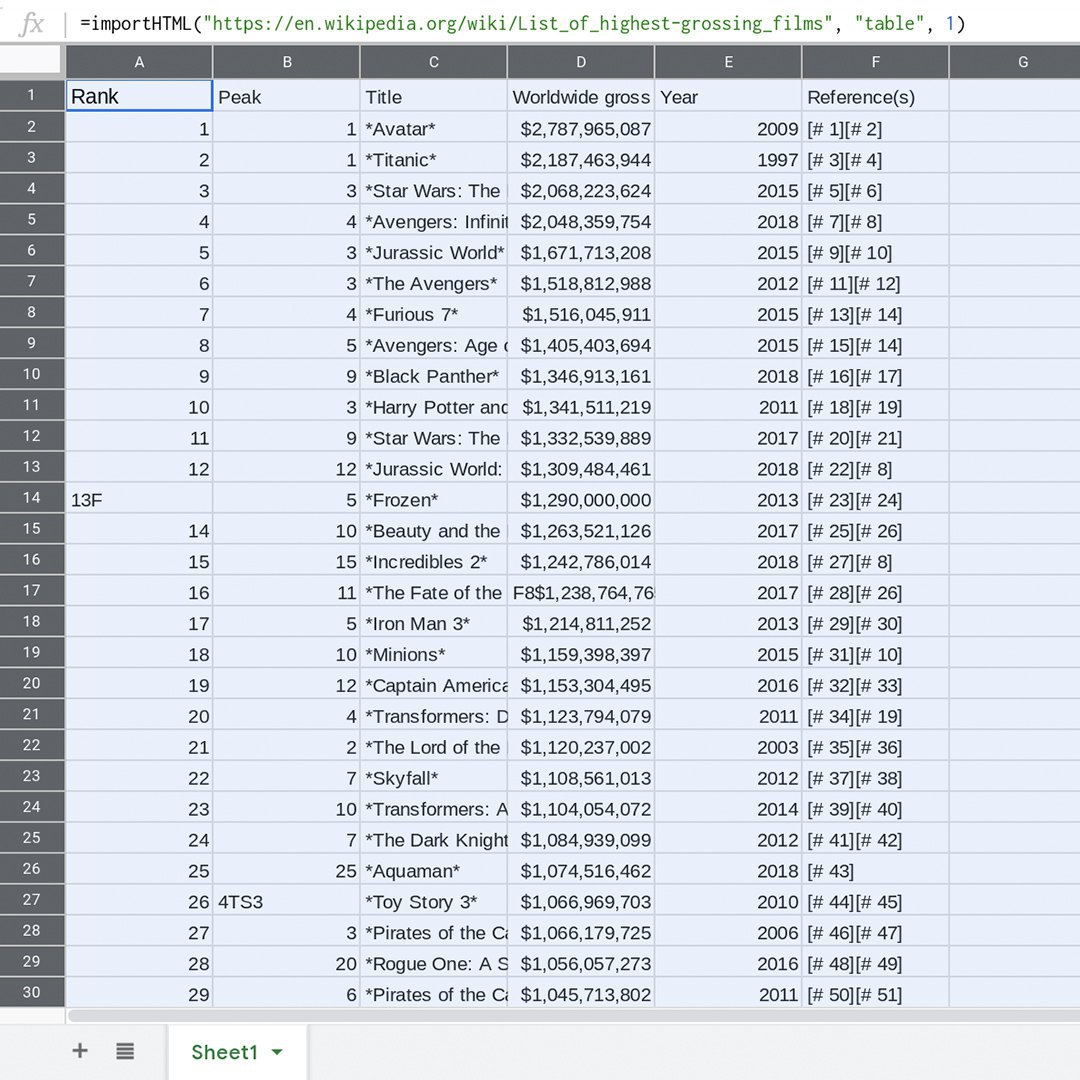
Access Google Finance data in Sheets

lesson 5 minutes Beginner
Access Google Finance data in Google Sheets. Examine closing prices, percentage change or market movement over any timeframe.
VisualizingData_overview_iskVm5I.jpg

Google Sheets: Visualizing data

lesson 5 minutes Beginner
Learn to build visualizations that help you interpret the data and tell data-driven stories.
GO801_GNI_Flourish_TitleCard.jpg

Visualising Data: Flourish templates.

lesson 5 minutes Beginner
A simple tool to help newsrooms create beautiful graphics.