Basics of Google Trends
This beginner’s course will teach you the basics of Google Trends, using the free Trends Explore tool.
Lesson overview
What is Google Trends?
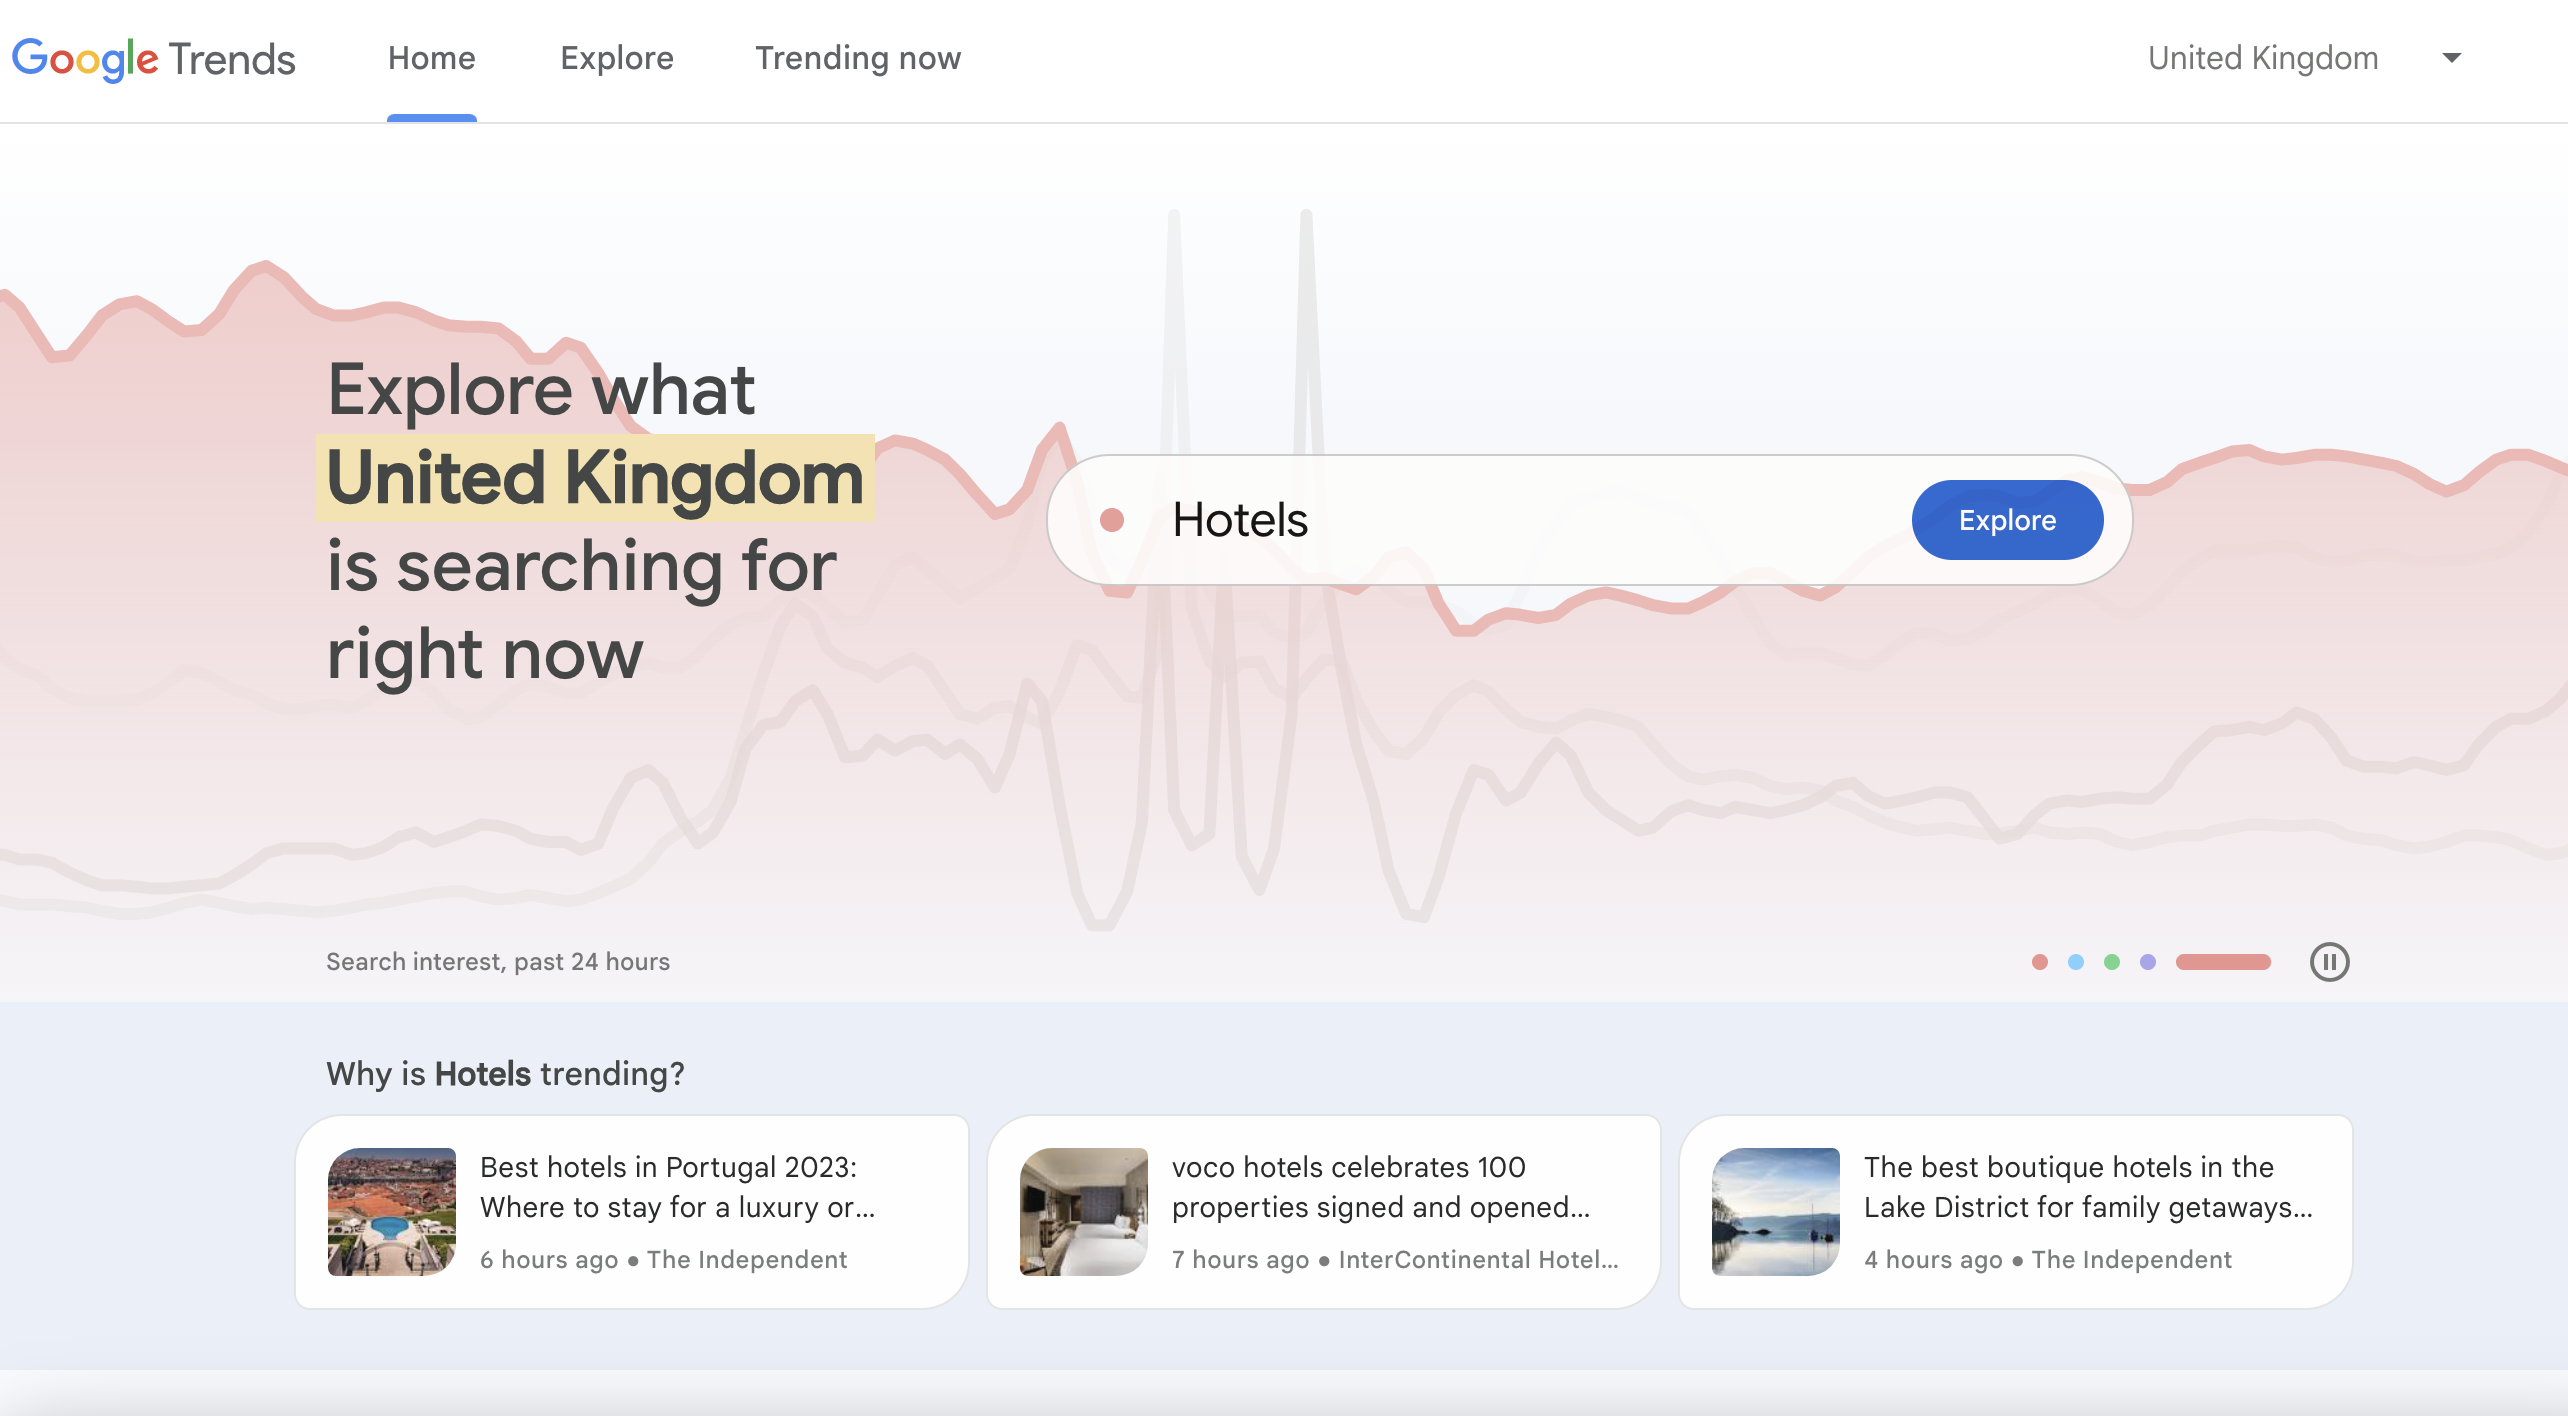
Google Trends tells us what people are searching for, in real time. We can use this data to measure search interest in a particular topic, in a particular place, and at a particular time. This lesson will teach you how Google Trends works, and will empower you to interpret this data for yourself.
- Selecting a topic
- Reading the interest over time graph
- Understanding the numbers
- Searches by location
- Top and rising searches
- Data excluded from search
For more lessons, visit:
Selecting a topic
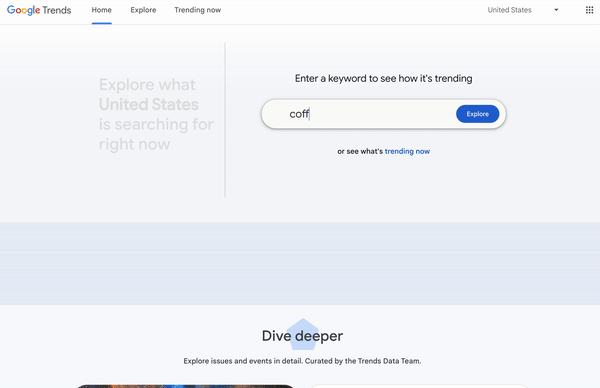
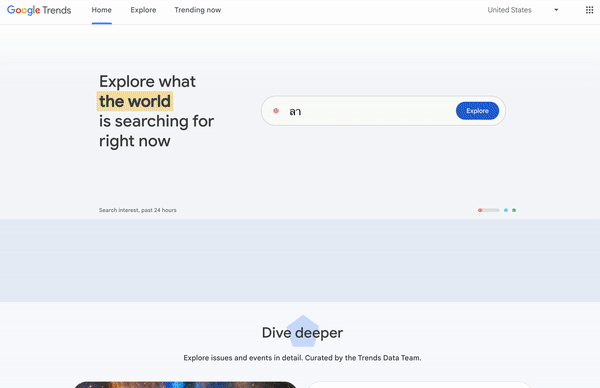
You can explore Google Trends data using the free Trends Explore tool. The data is grouped into topics to give you the fullest picture of what people are searching for. You can also query individual search terms.
As you type your query, a drop-down list will appear. At the top is the exact search term you typed. Below, you’ll see a list of topics which Google Trends believes you may be trying to research.
If you see the relevant topic in the drop-down list, click on it to view the data. Otherwise, use the search term.Topics are generally considered to be more reliable for Google Trends data. They pull in the exact phrase as well as misspellings and acronyms, and cover all languages. This is more useful, particularly when looking at world data.
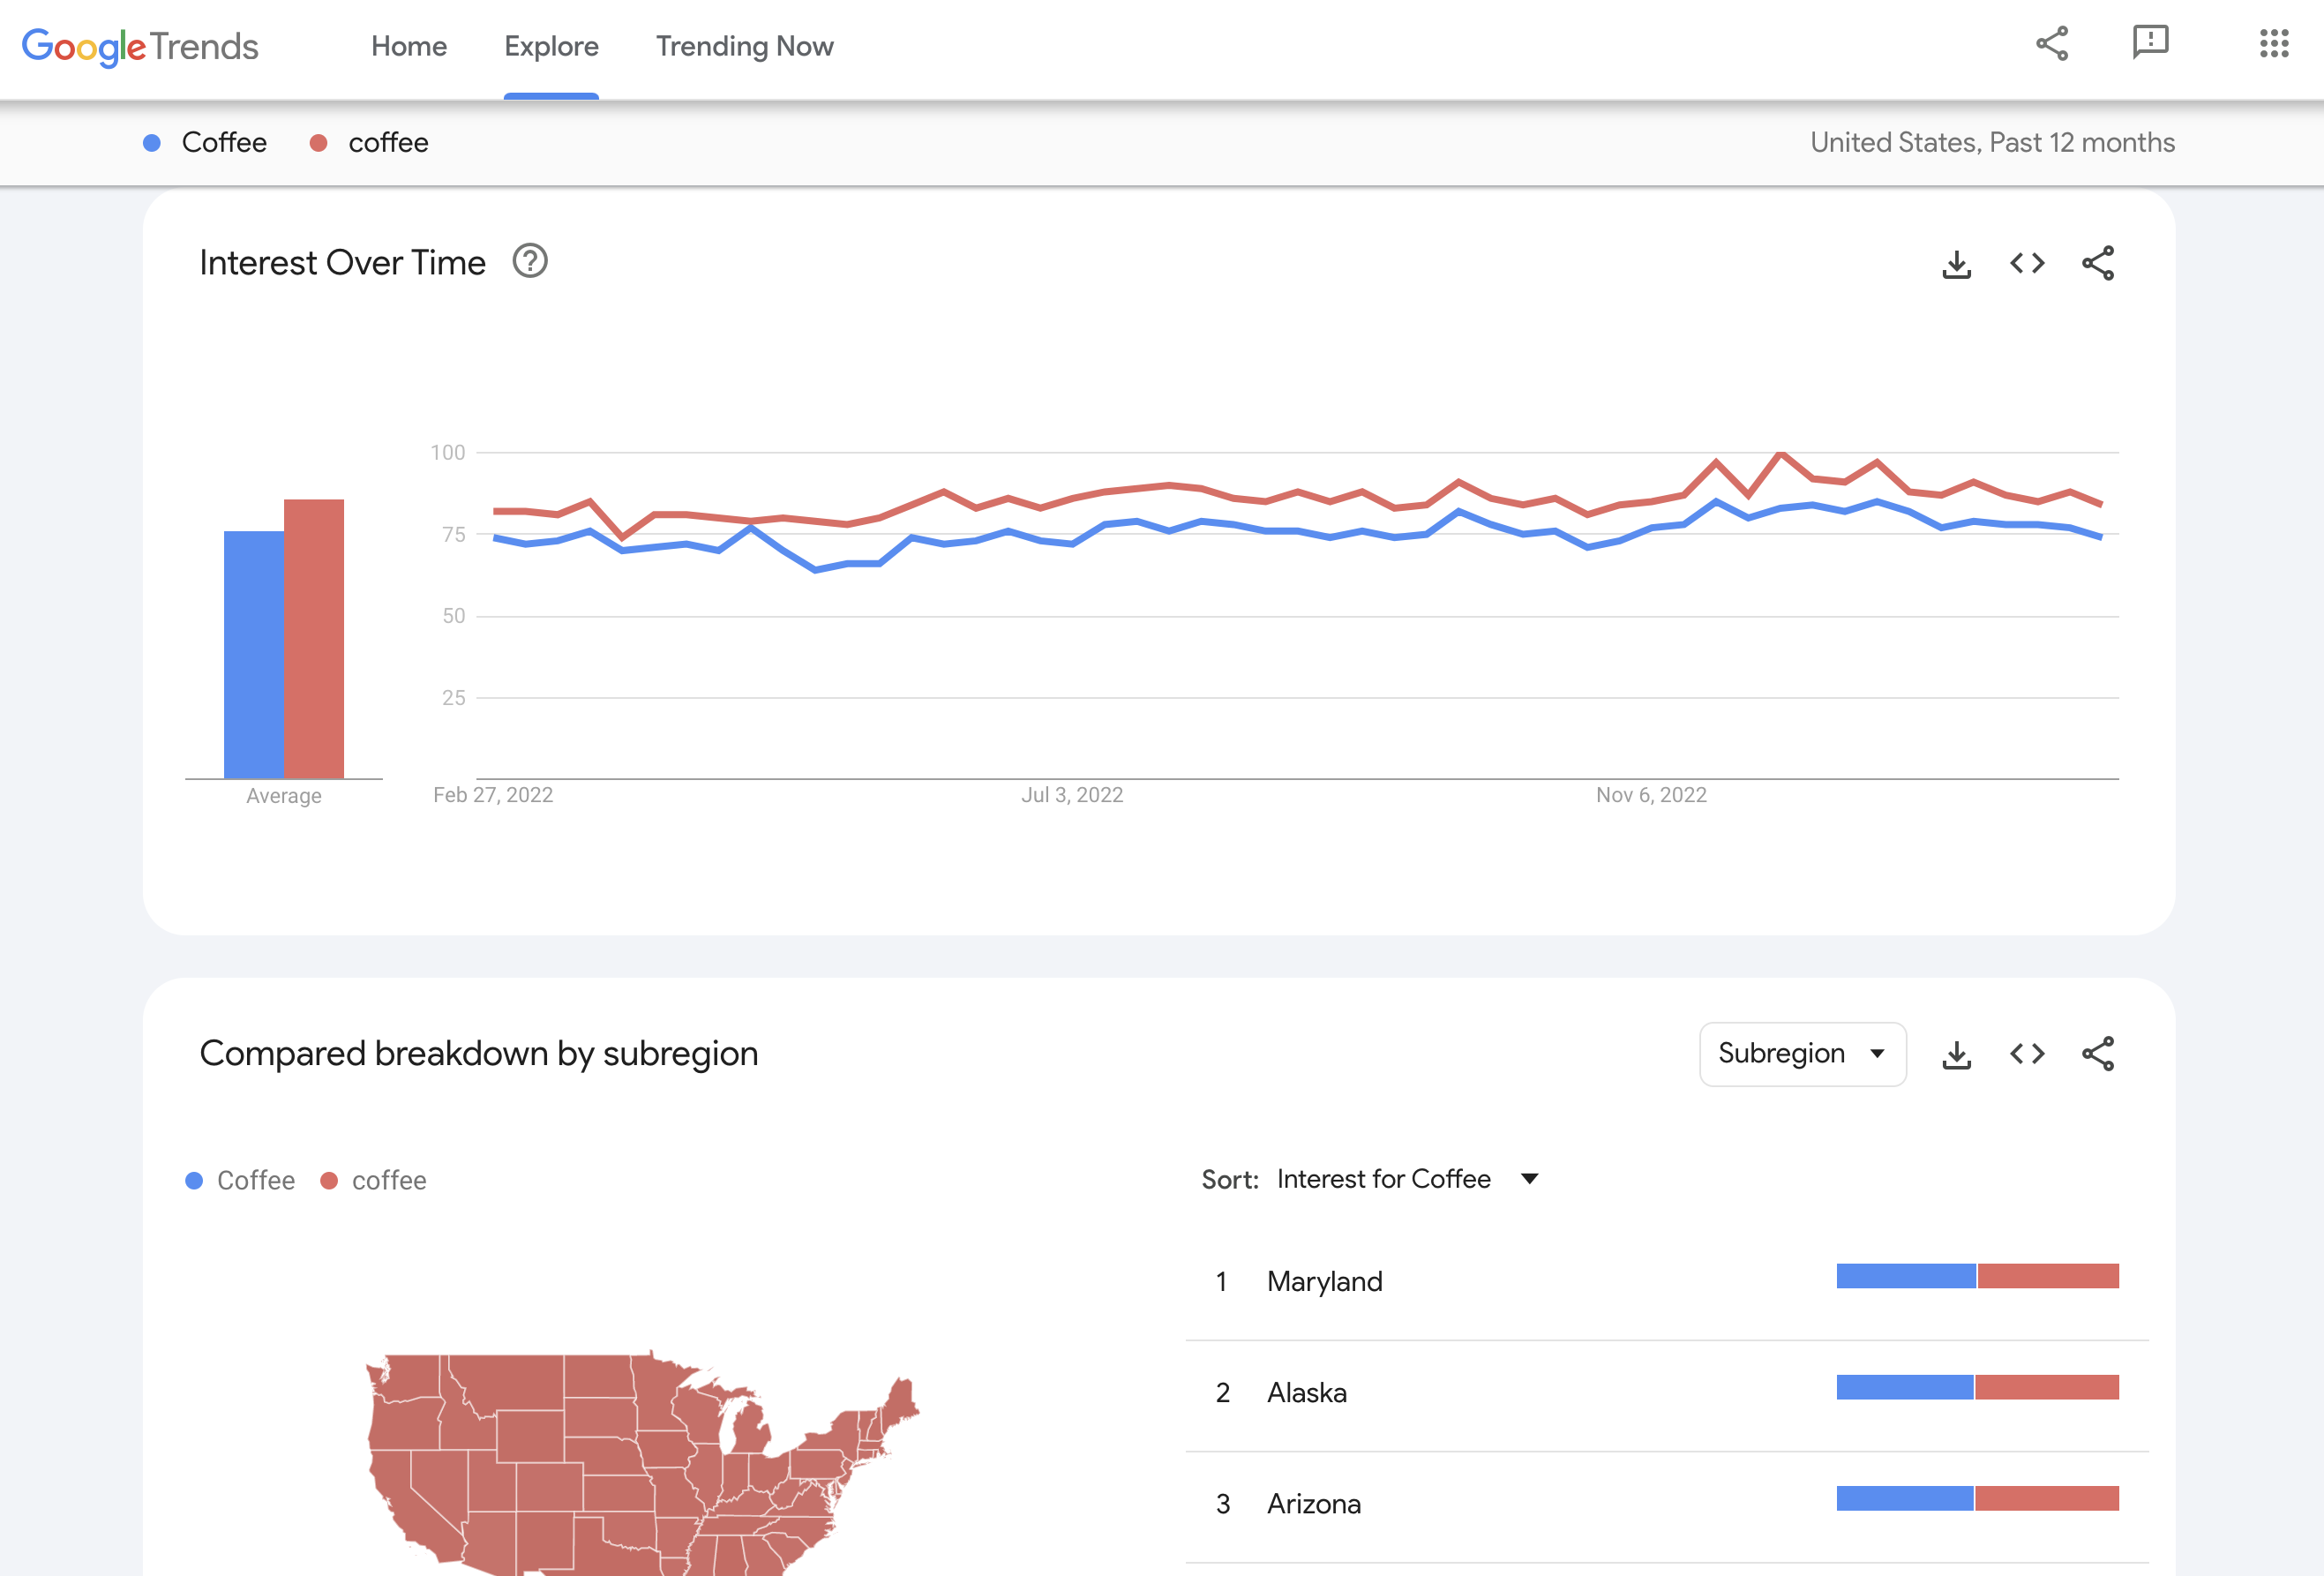
To get a better understanding of the difference between topics and search terms, explore a search term and a topic with the same title, at the same time. You will notice the results look different.
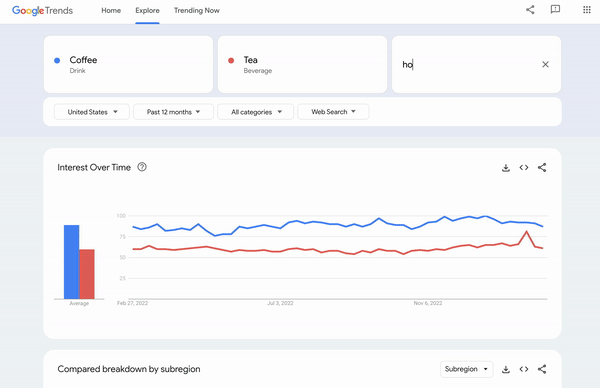
You can explore up to five topics or terms on the Trends Explore tool. Make sure you compare like for like -- topics should be compared with other topics, and search terms should be compared with other search terms.
Reading the interest over time graph
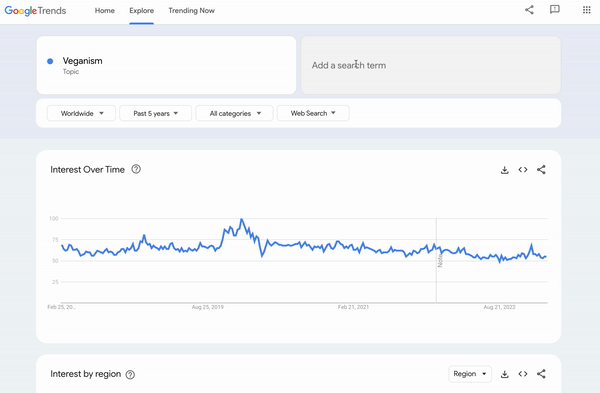
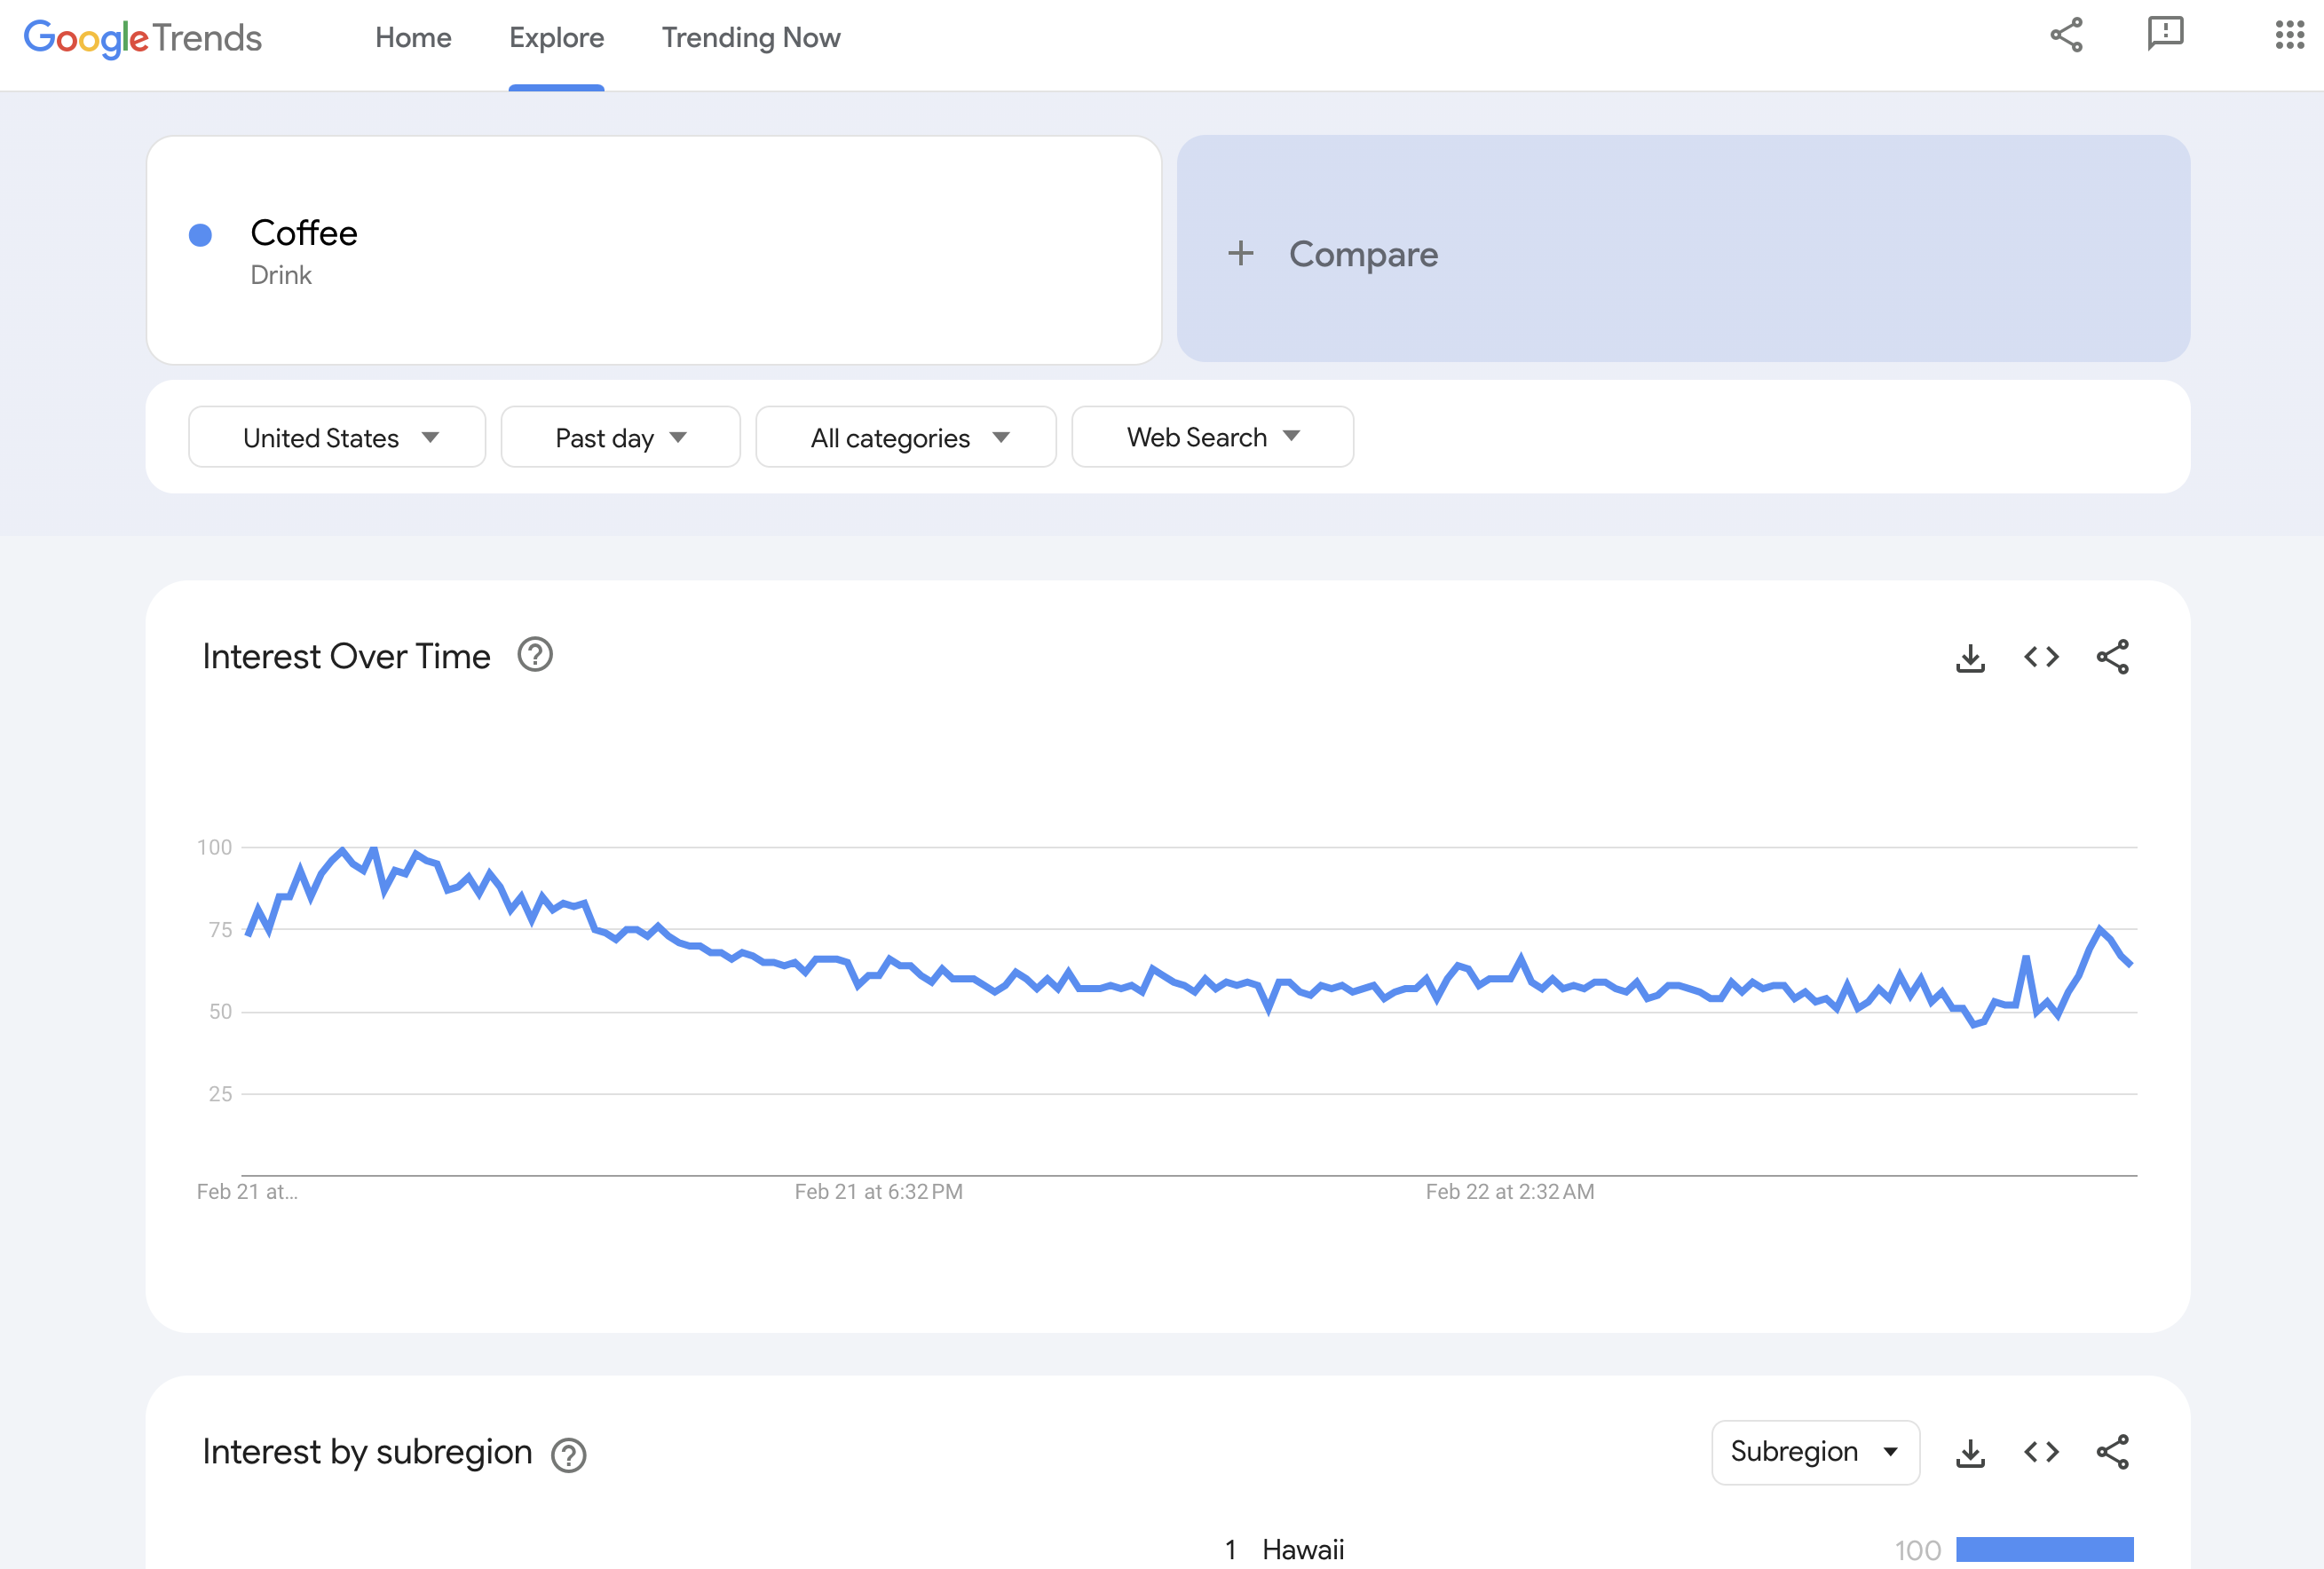
When you search for a topic on Trends Explore, you’ll see a graph showing its popularity over time. Being able to read this graph is the first step to understanding the numbers behind Google Trends.
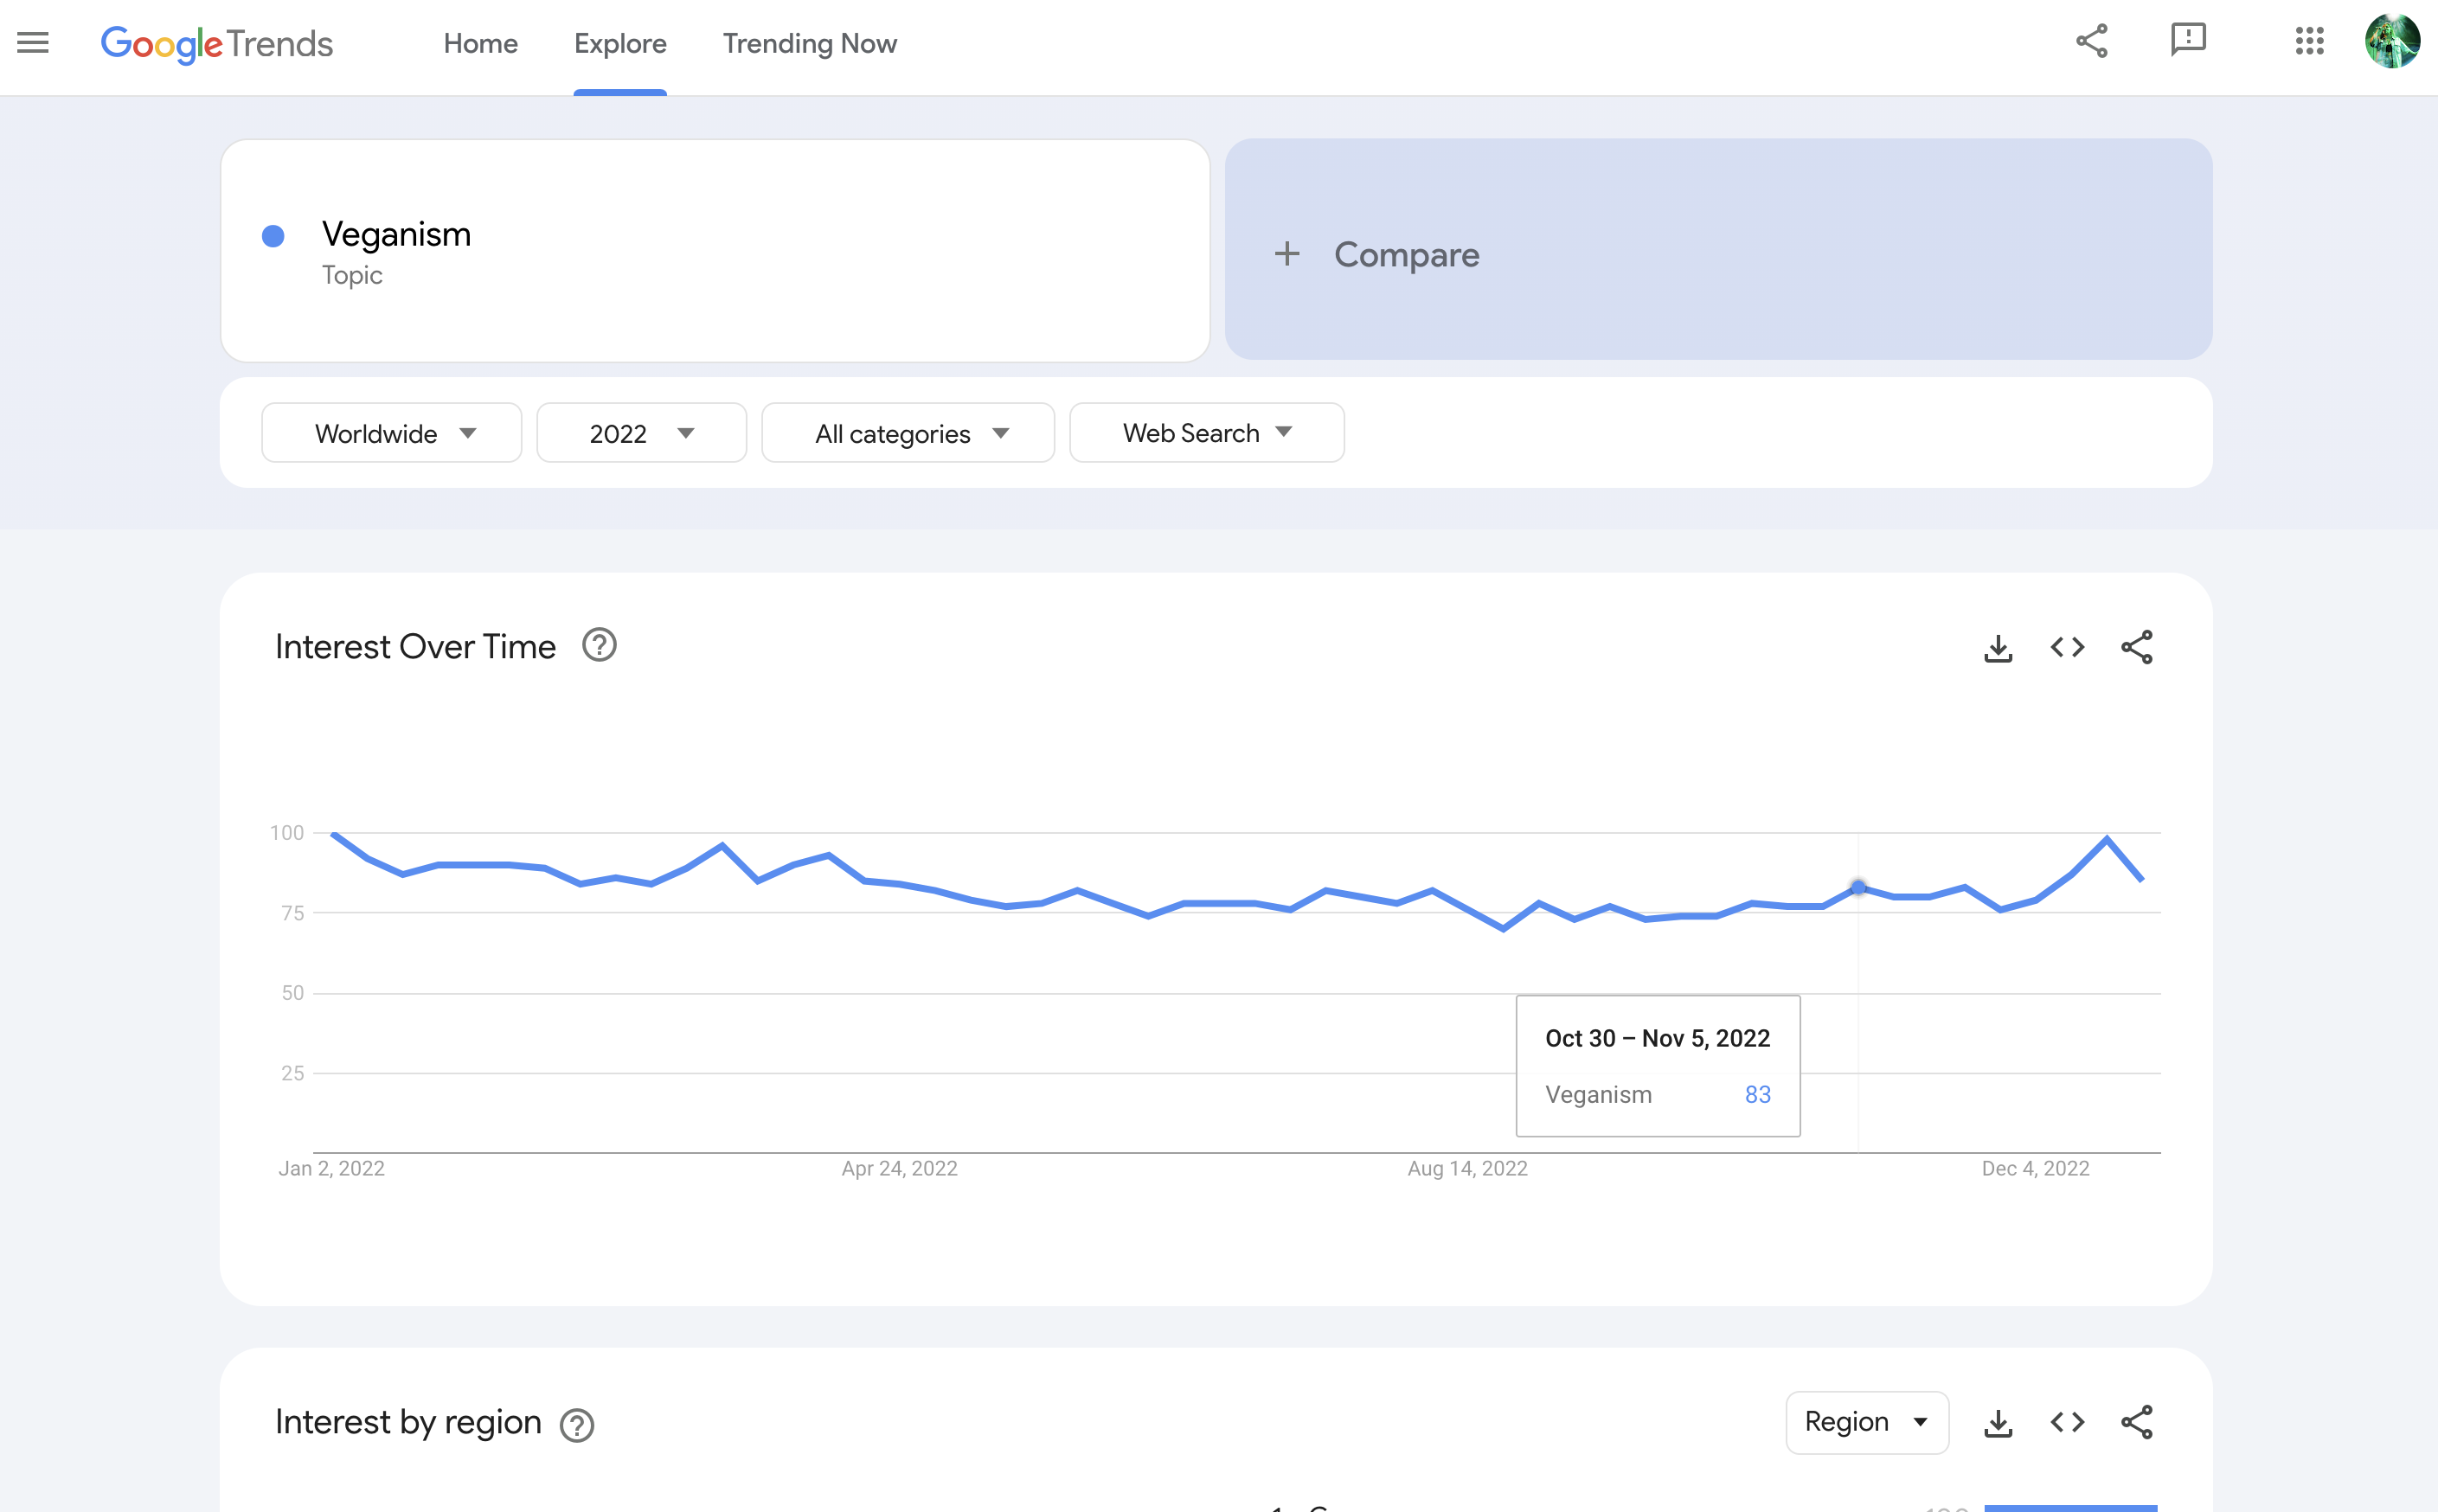
Let’s search the topic Veganism. Use the drop-down menus to specify Worldwide and the year 2017. Hover over the graph to see search interest over time, numbered from 1-100. Find the maximum value on the graph and make a note of the date.
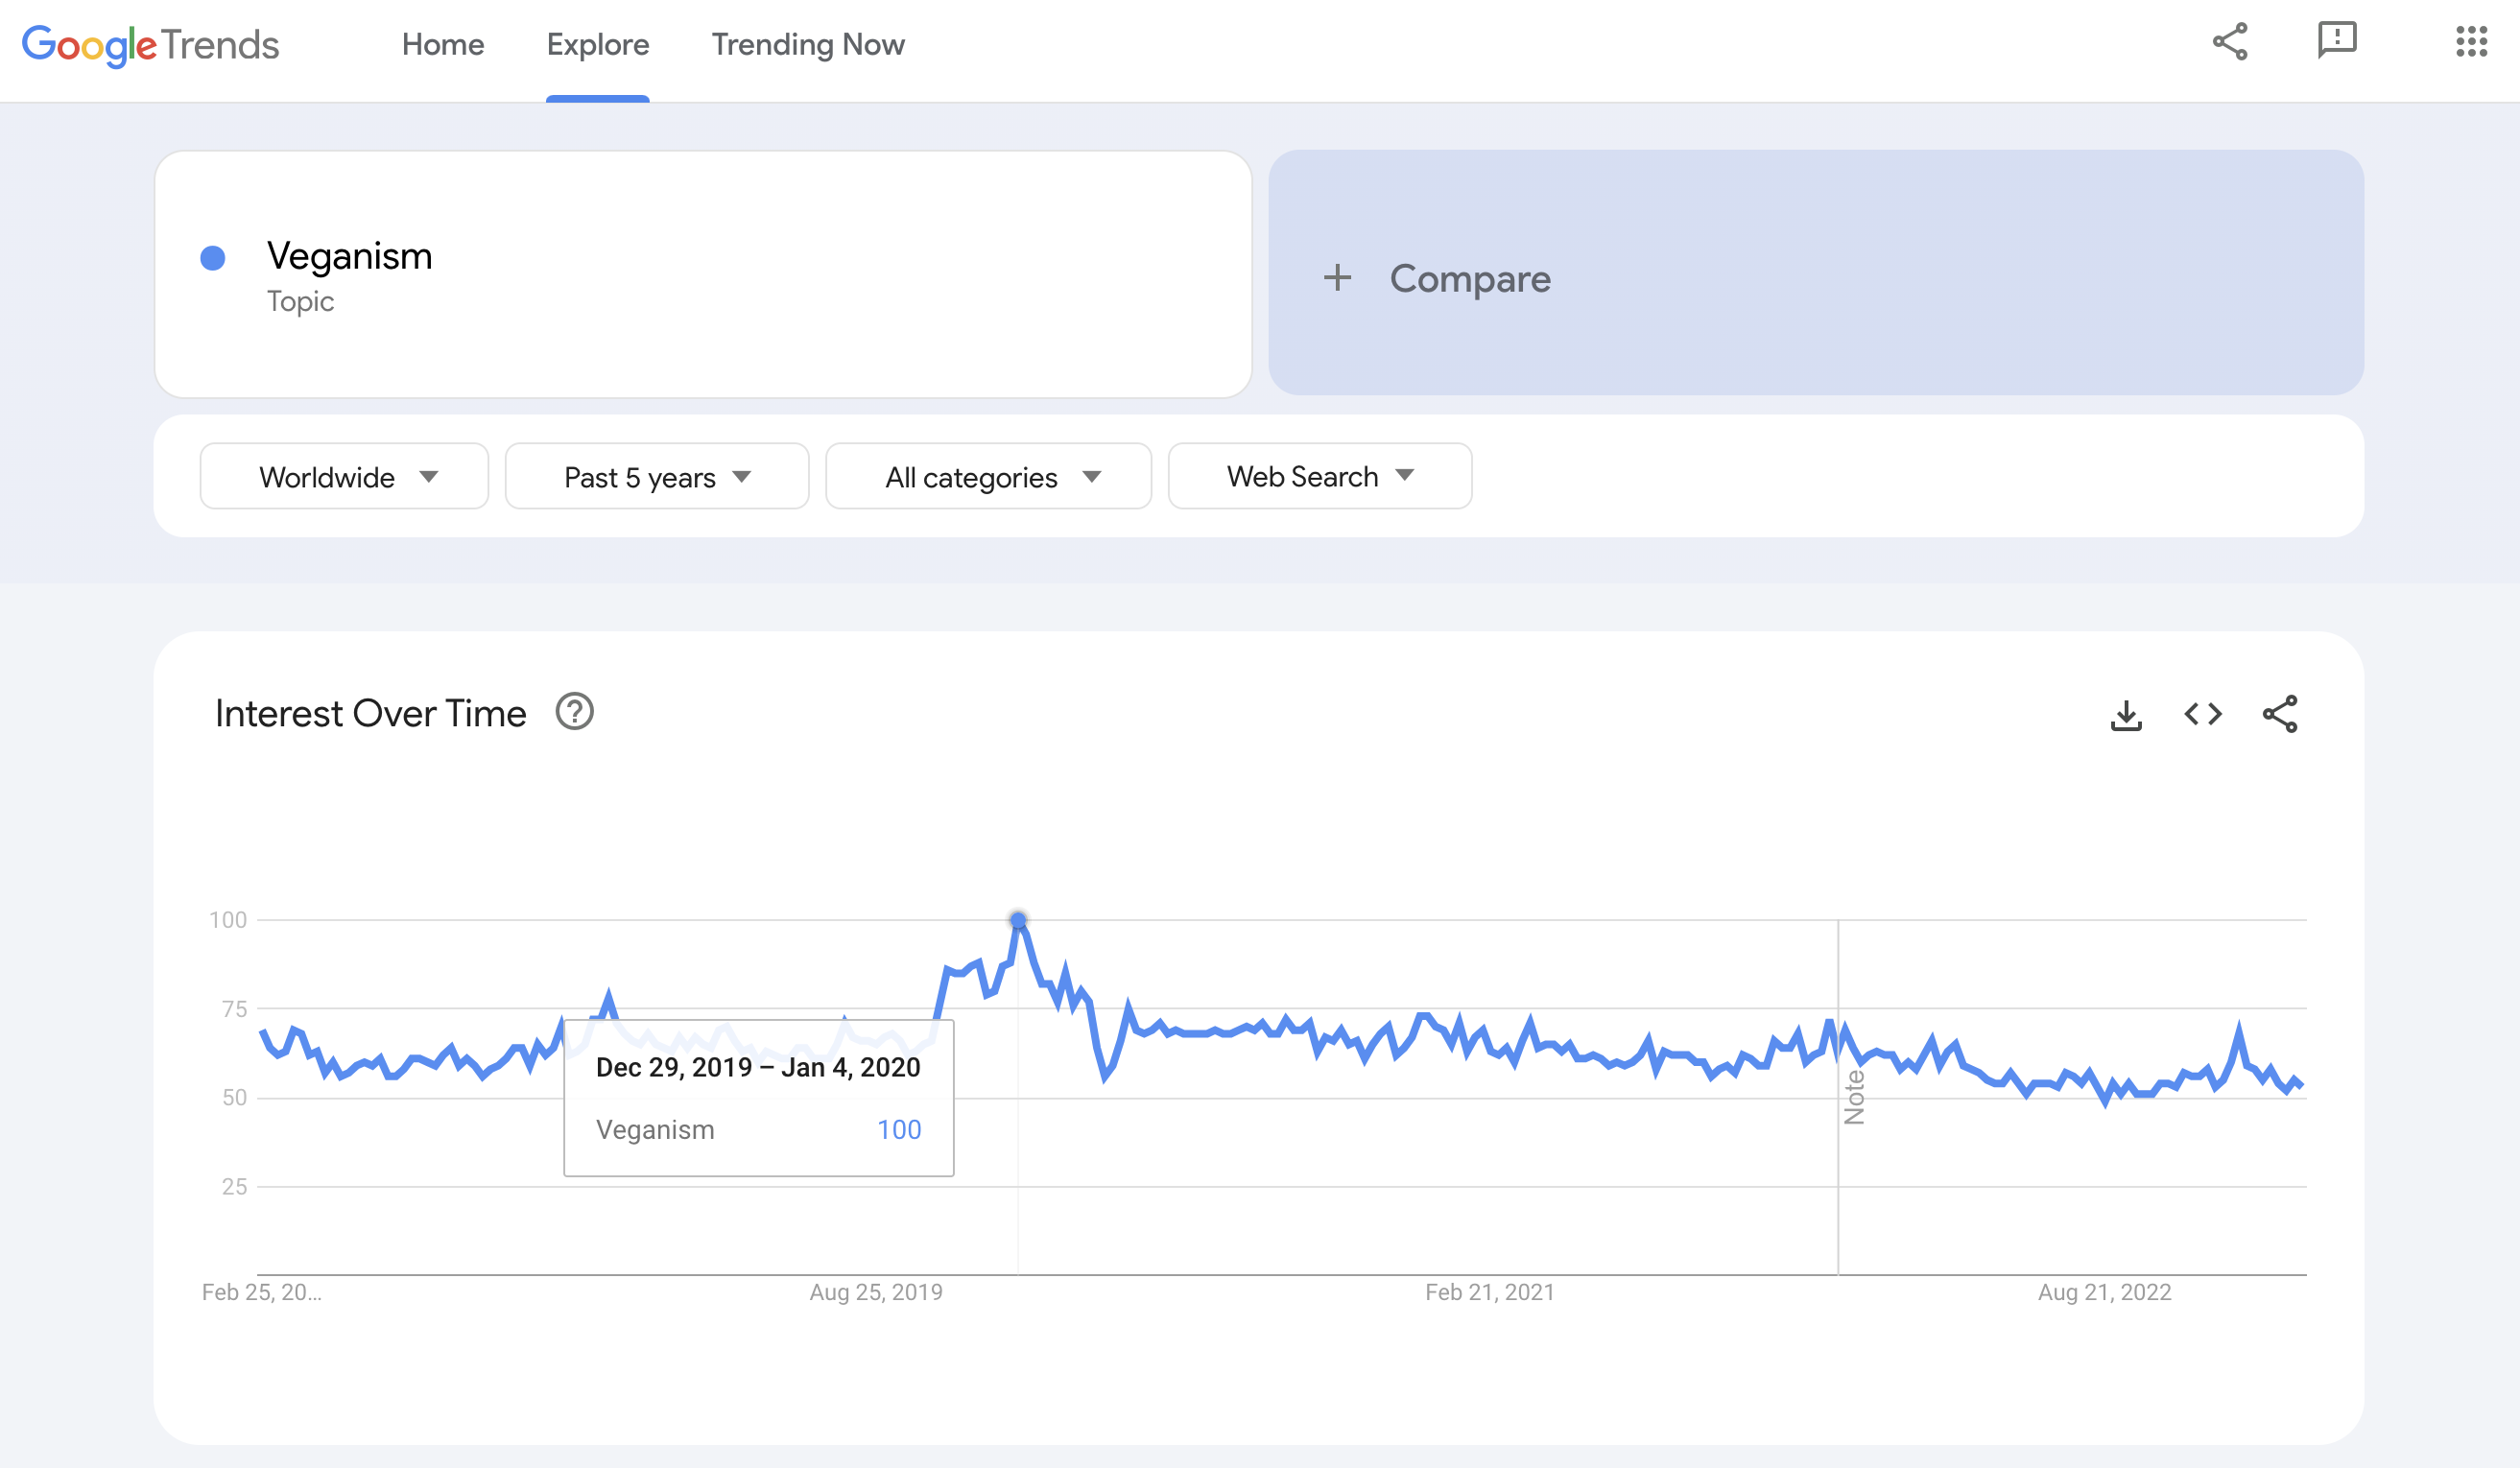
Let’s change the time range of the data to Past 5 years.The maximum value on the graph is still 100, but the date of this value has changed. See if you can locate the peak from the previous graph, too.
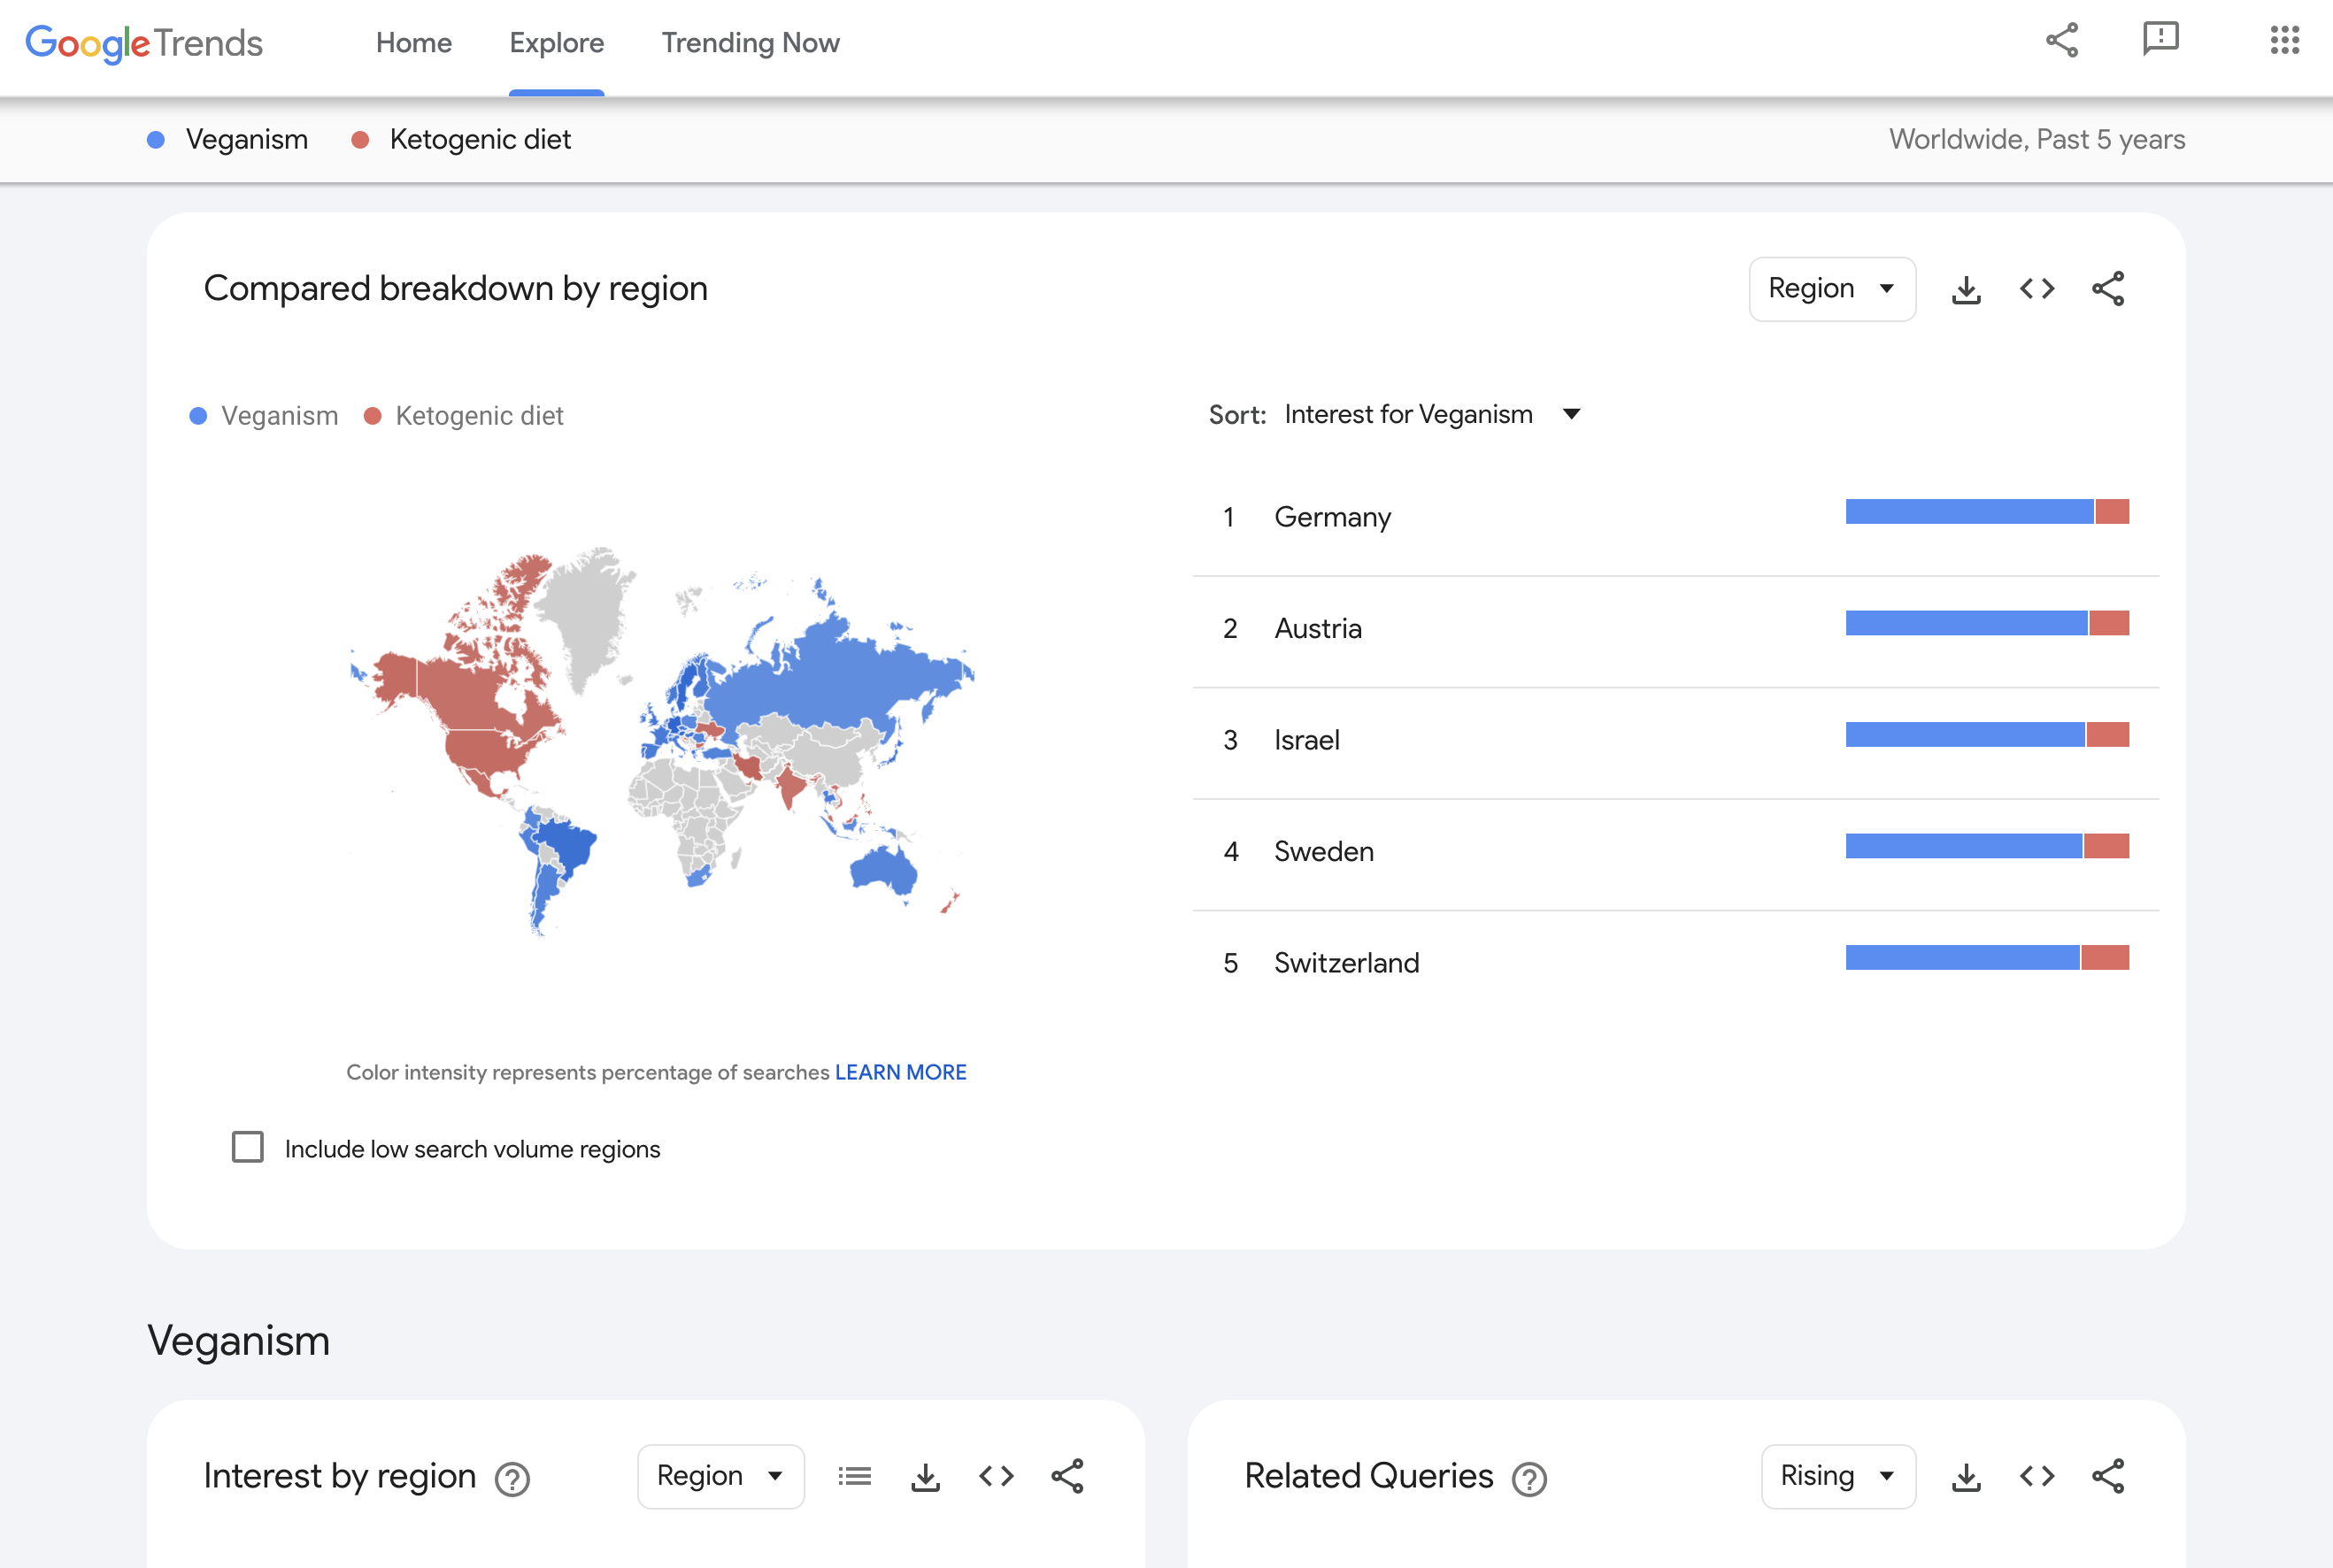
The values on the graph do not represent absolute search volume. Instead they are normalized, then indexed on a scale from 1-100. Each point on the graph is divided by the highest point, 100.See how the maximum points change again when we click + Add comparison and type in another topic, such as ketogenic diet.
Understanding the numbers
By now, we’ve already heard that data on the Trends Explore tool is indexed and normalized. But what does this actually mean?
Indexing: Google Trends data is pulled from a random, unbiased sample of Google searches, which means we don’t have exact numbers for any terms or topics. In order to give a value to terms, we index data from 1-100, where 100 is the maximum search interest for the time and location selected.
Normalization: When we look at search interest in a topic or query, we are not looking at the total number of searches. Instead, we look at the percentage of searches for that topic, as a proportion of all searches at that time and location.
Searches by location
Google Trends also breaks down data by location. In this section, we will explore the basics of location data with Google Trends, and understand the numbers behind this.
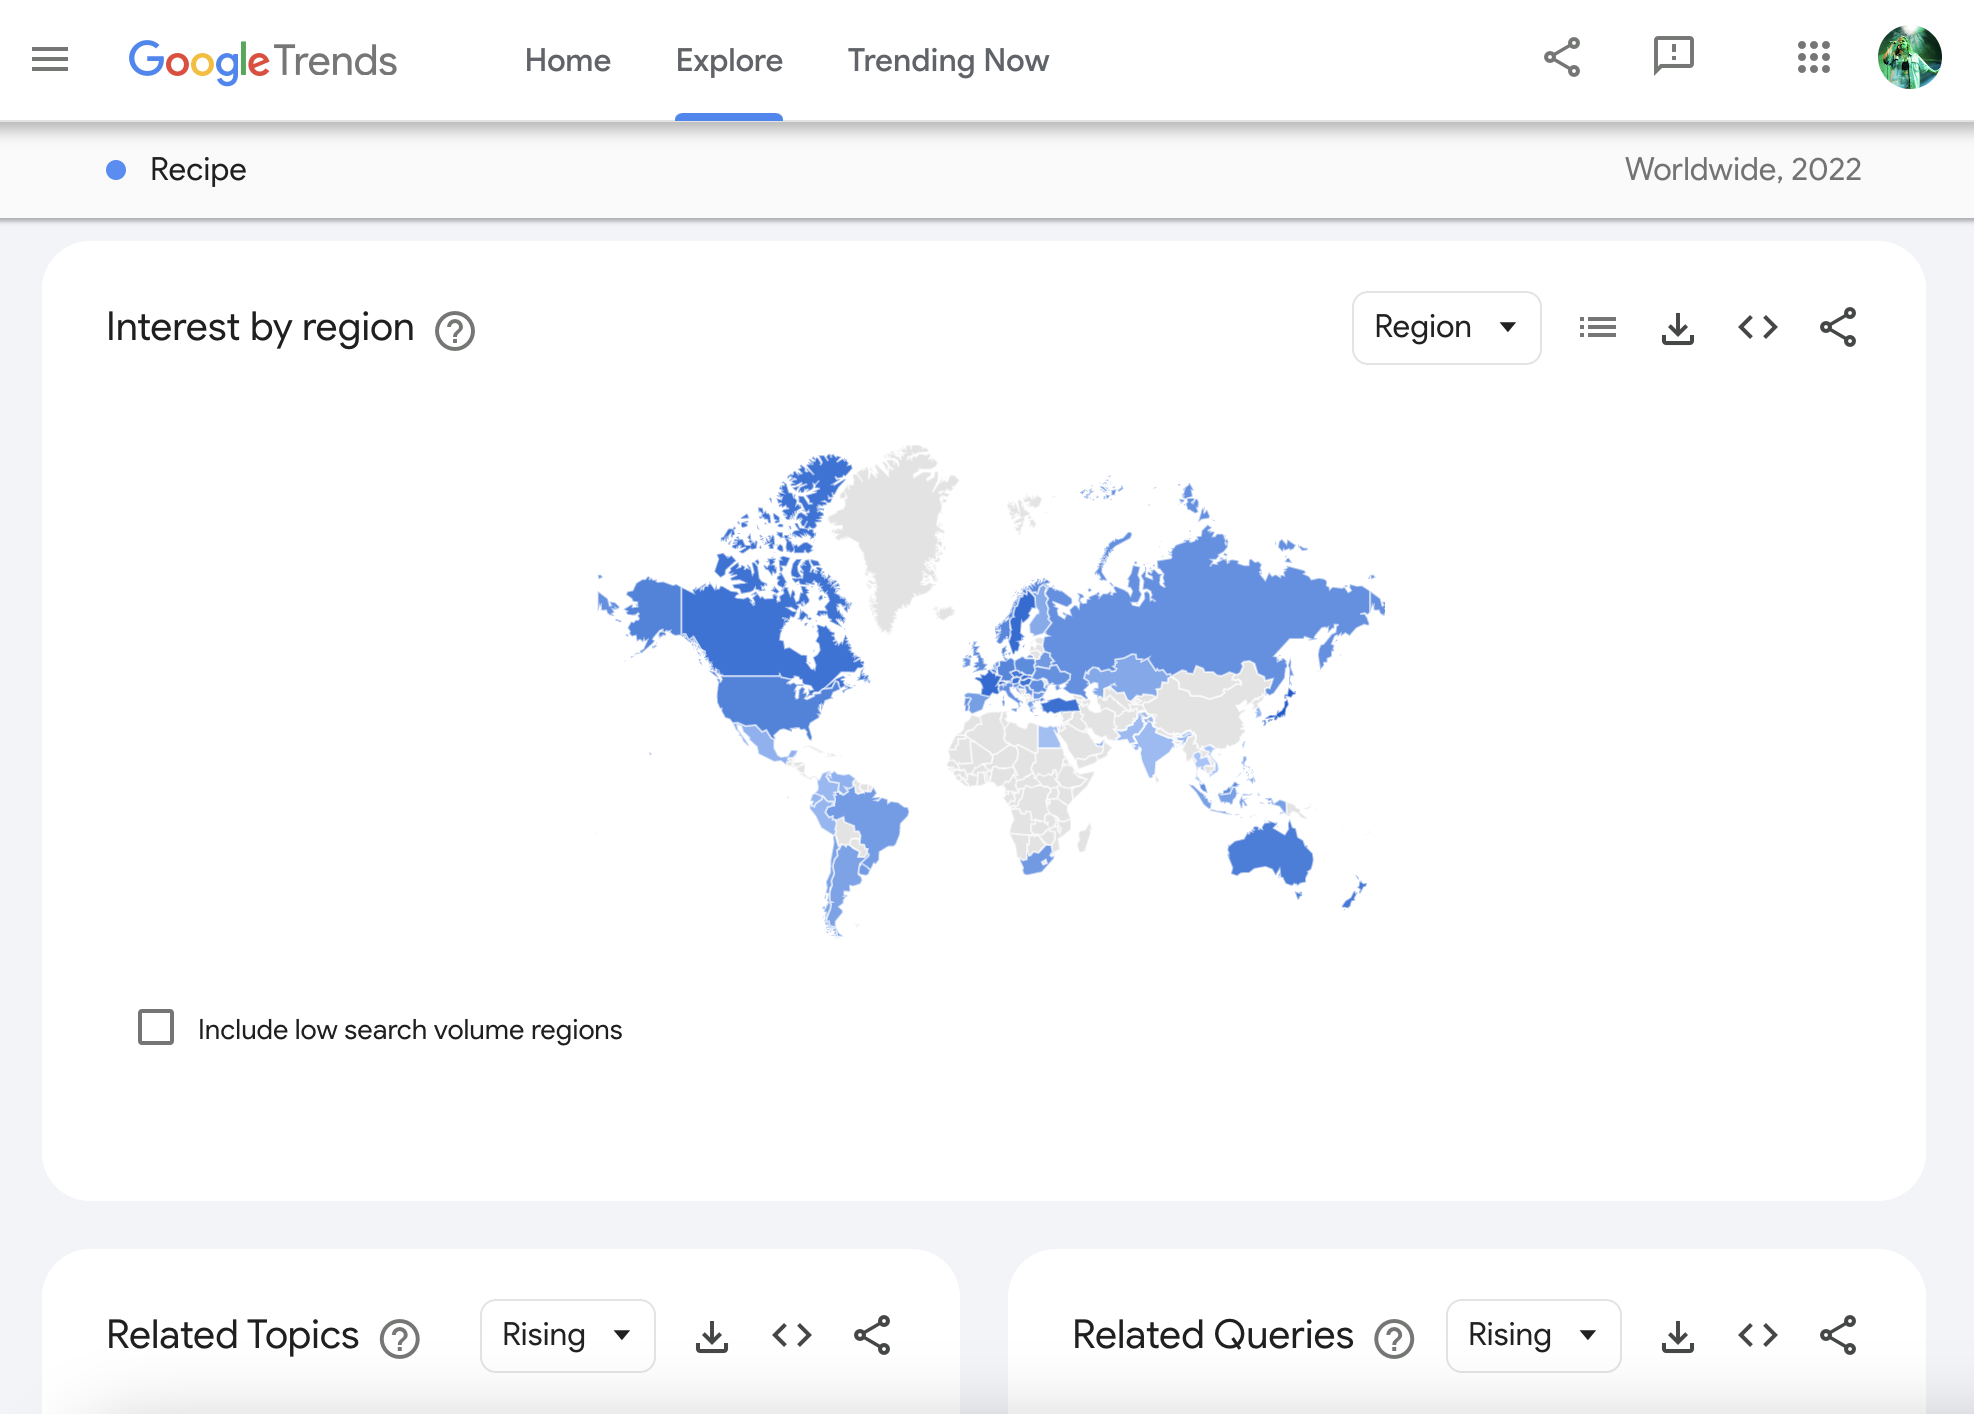
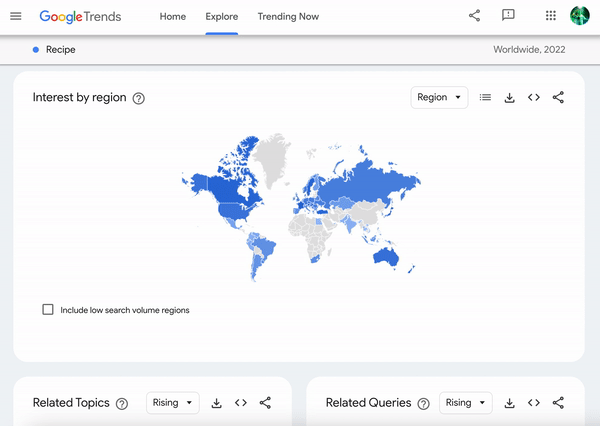
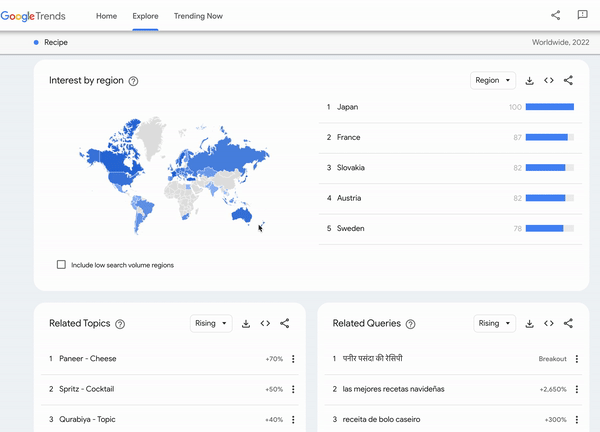
Once you have performed your Google Trends search, scroll down to see search interest by location.If your location is set to Worldwide, you will see search interest by country. If you have selected a country, you will see Interest by region. Darker-shaded areas have a higher level of search interest.
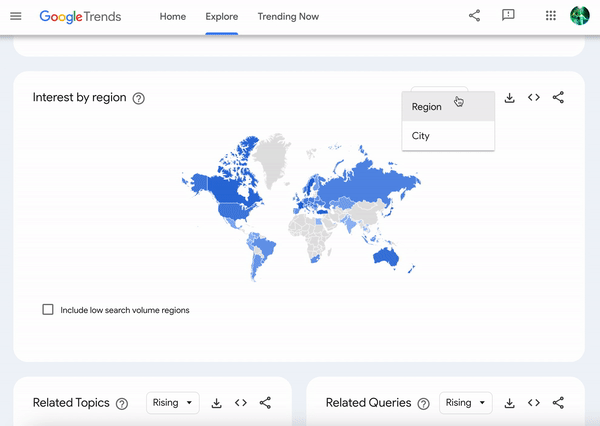
Trends Explore will automatically show you the map view of your data. Toggle between map view and list view using the button with three stacked horizontal lines, at the top right of the map. If your window is wide enough, you will be shown both views simultaneously.
You can view Google Trends data grouped by country, region, and city. In some countries, you can also view search interest by metro area. To select the breakdown you want, use the menu at the top right of the map.
When you hover over a country or use list view, you’ll see an indexed search interest value between 1-100, just as you do with other Trends data.The location with the highest normalized interest in the topic valued at 100, while all other values are indexed proportionally.
Top and rising searches
Top and rising search topics and queries make up the final key element of the Trends Explore tool. In this section, we’ll learn how to read and understand this data.
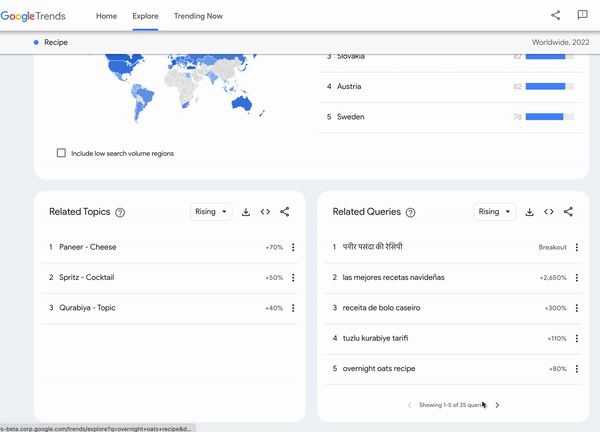
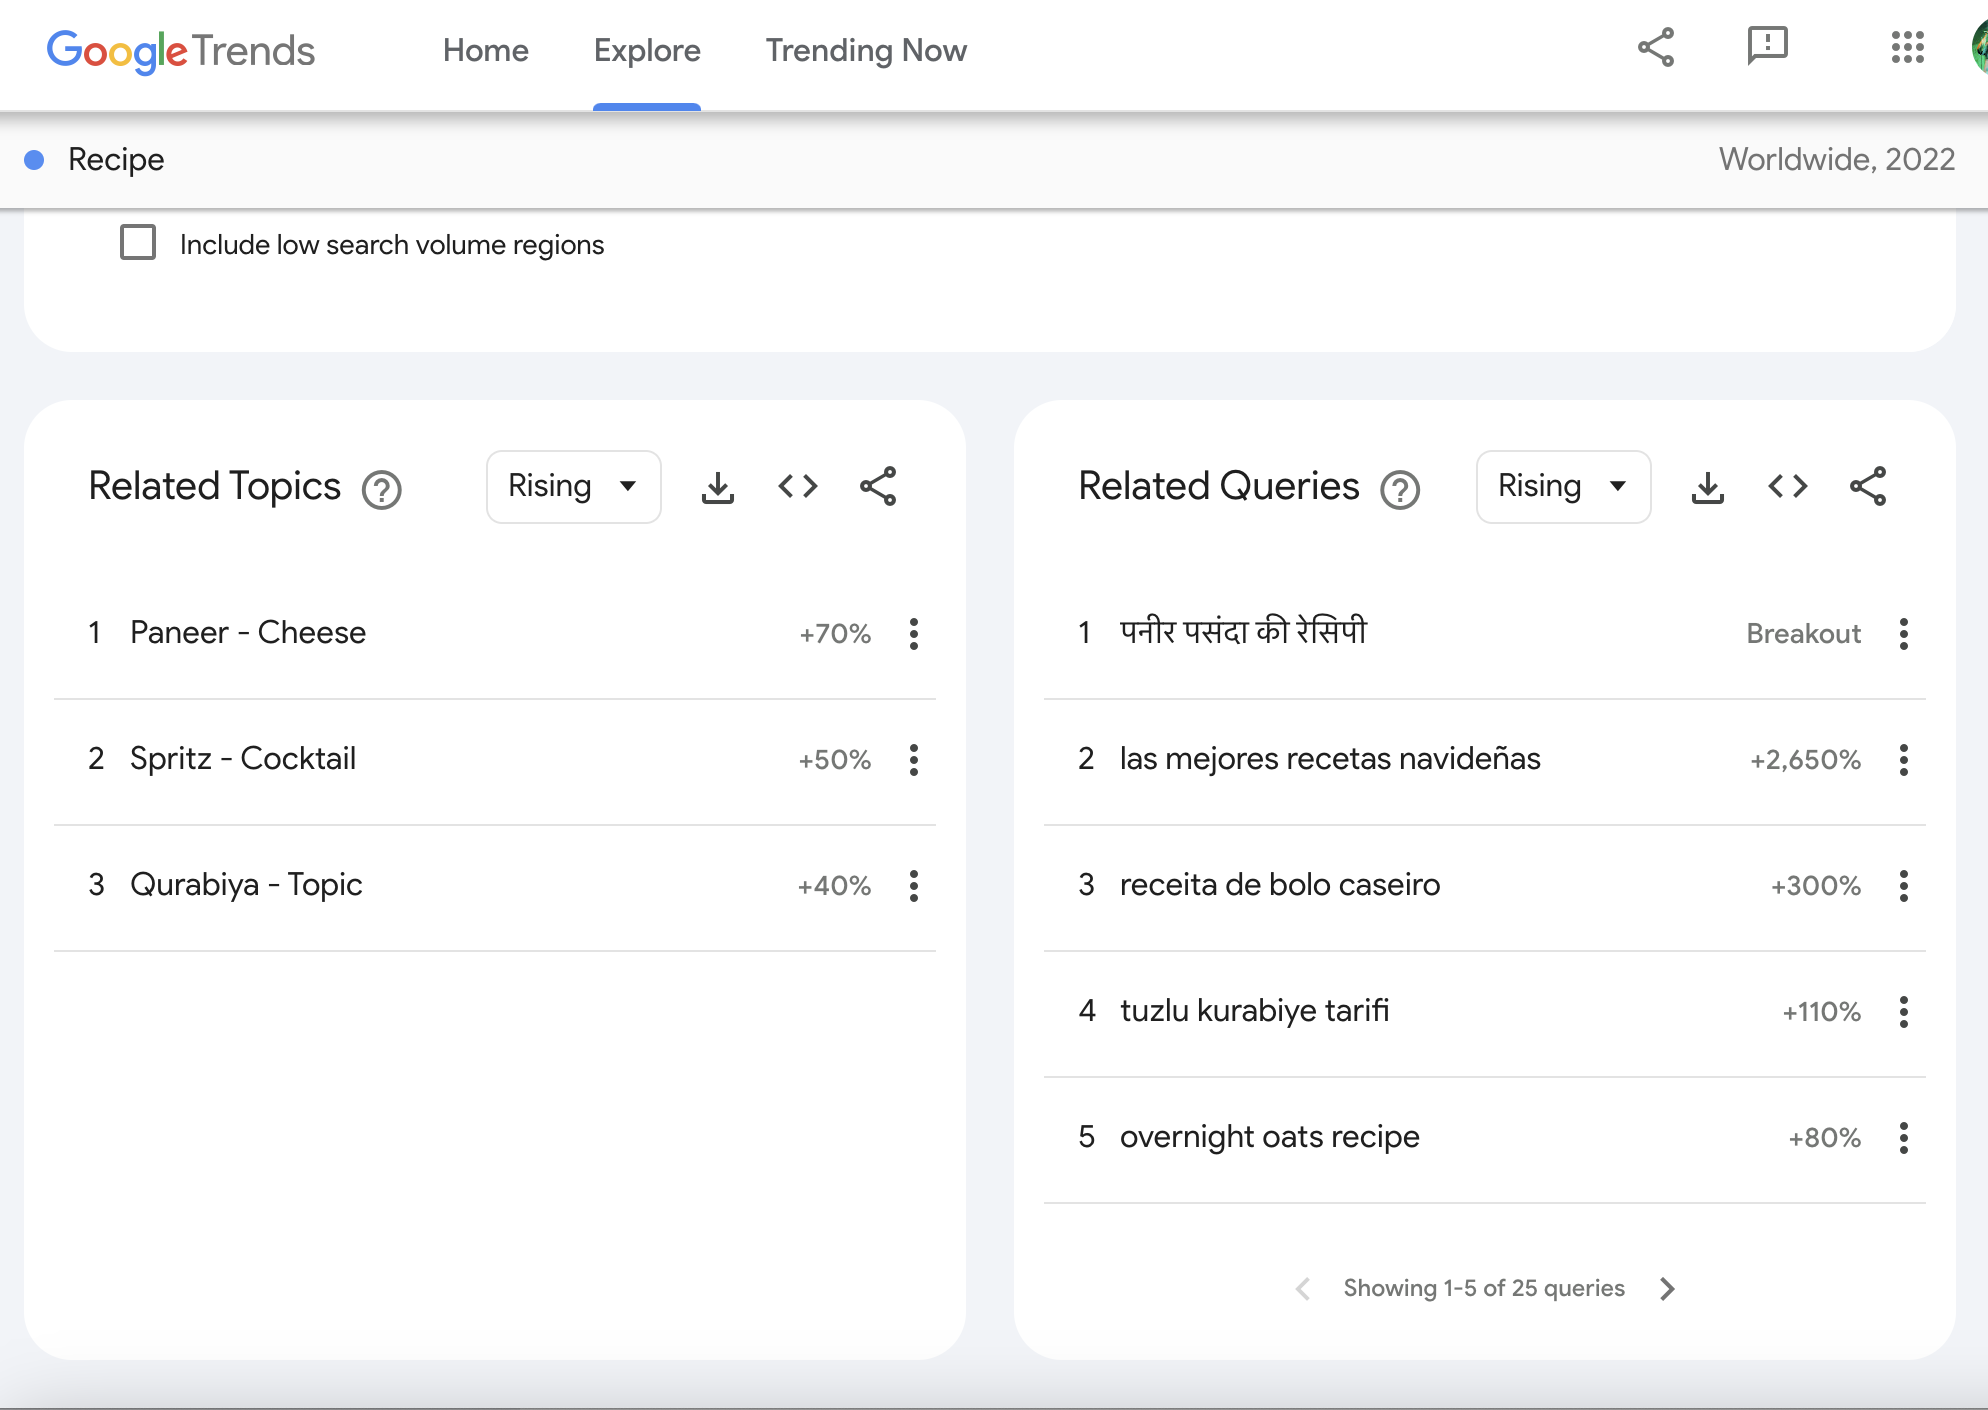
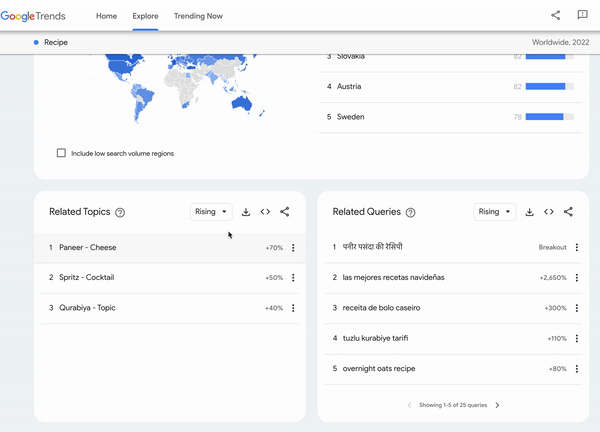
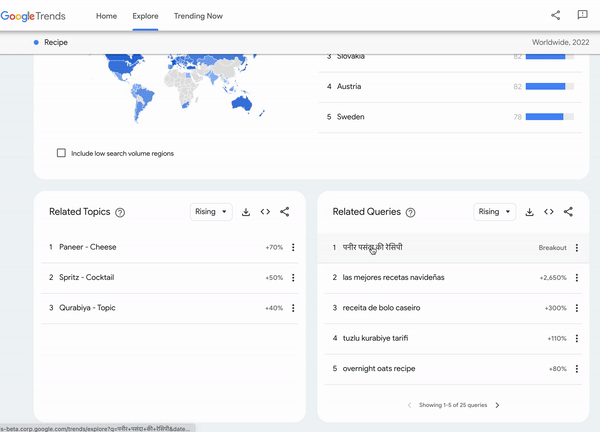
At the bottom of your Trends Explore page, you’ll see tables of Related topics and Related queries pertaining to the term or topic you entered. To scroll through the results, click the arrows below the table.
Trends Explore will automatically display “rising” data for both topics and queries. These have seen the largest increase in search interest over the selected time period. You can see the percent increase in search interest next to each topic or search term.“Breakout” searches have increased by over 5000% percent in the given time frame. Usually these are new, or had very low search volume before.
Click on the top right of the widget where it says Rising and switch to Top. These are the queries or topics with the highest search volume in the selected time frame and location. These are indexed and normalized values from 1-100.
Click on a top or rising topic or query to explore it in more detail.
Data excluded from Google Search
Trends excludes certain data from your searches.
- Searches made by very few people: Trends only analyzes data for popular terms, so search terms with low volume appear as 0 for a given time period.
- Duplicate searches: Trends eliminates repeated searches from the same user over a short period of time for better overall accuracy.
- Special characters: Trends filters out queries with apostrophes and other special characters.
Pairing NCI with Google Trends
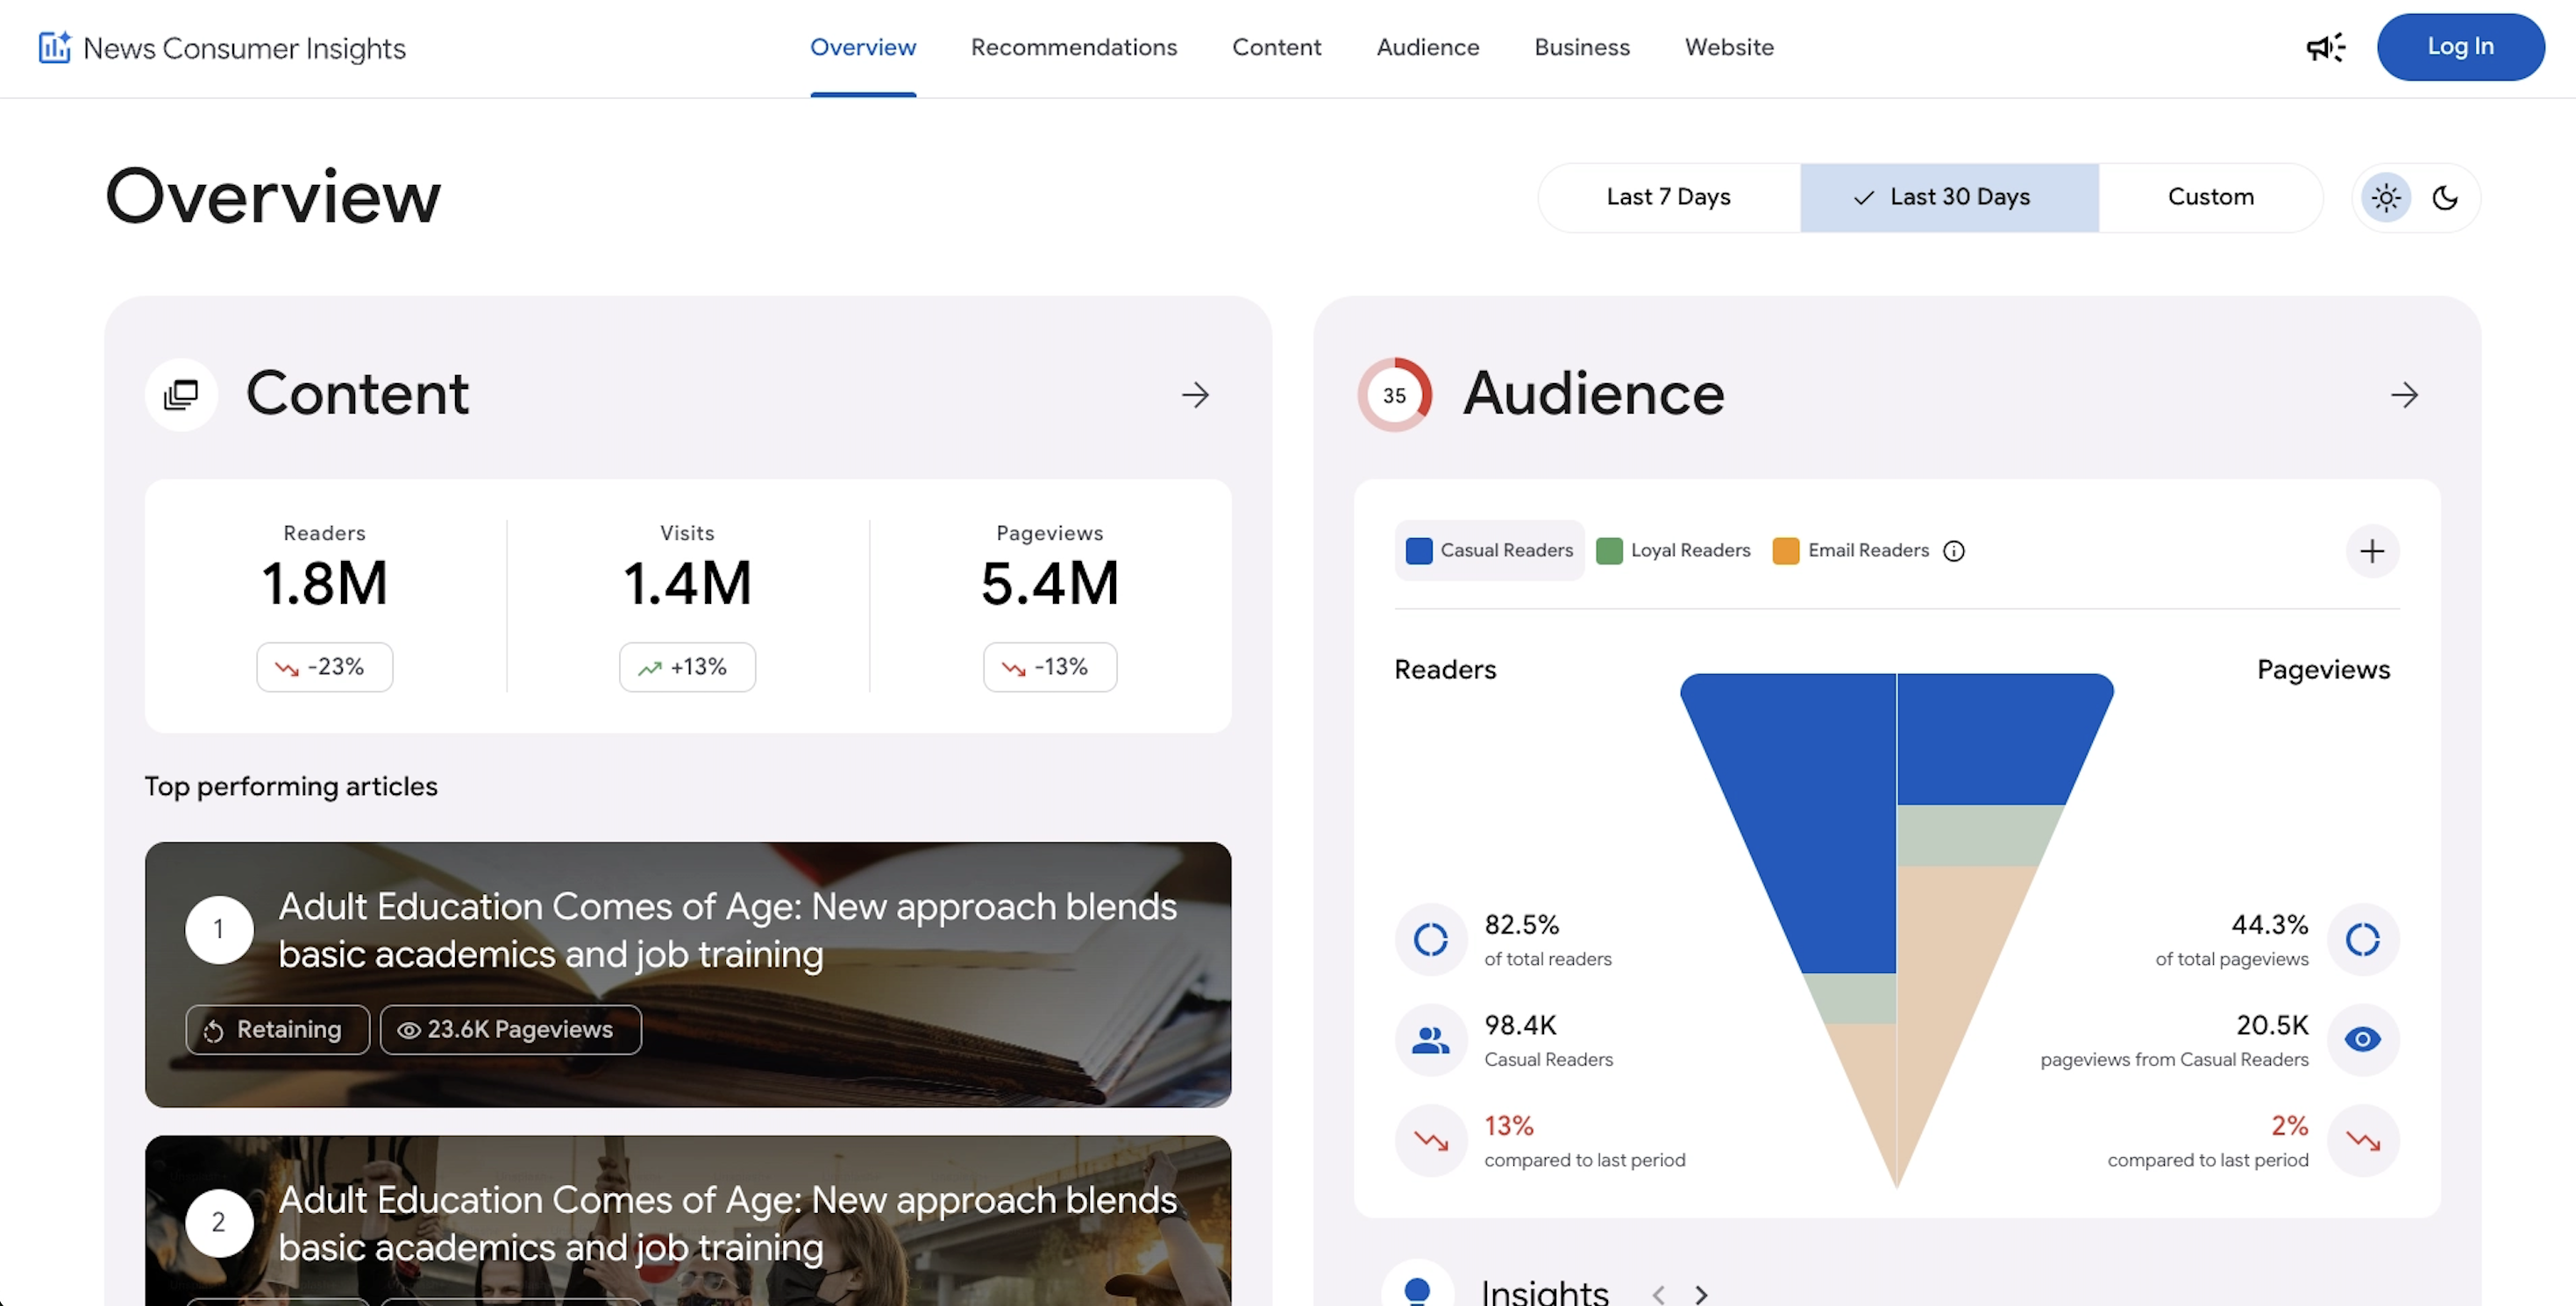
News Consumer Insights (NCI), our free of cost Google News Initiative data tool, gives you in-depth data about your audience's behavior on your news website. Google Trends shows you the overall popularity of search terms over time.
Use them together to:
- Validate your findings: See if rising engagement with a topic on your site aligns with growing search interest in that topic overall.
- Identify content opportunities: Discover trending topics that you might not be covering adequately on your site.
- Refine your content strategy: Tailor your content to match the evolving interests of your audience and the broader public.
Essentially, News Consumer Insights (NCI) tells you what's popular on your site, while Google Trends tells you what's popular in the world. Combining them gives you a powerful toolkit for understanding audience behavior and optimizing your content
Access News Consumer Insights here.
-
![G0801_GNL_YTStorytelling_Title_Card.jpg]()
-
![image13_2.png]()
Training your Machine Learning model
LessonImport your data in AutoML Vision and start the training process -