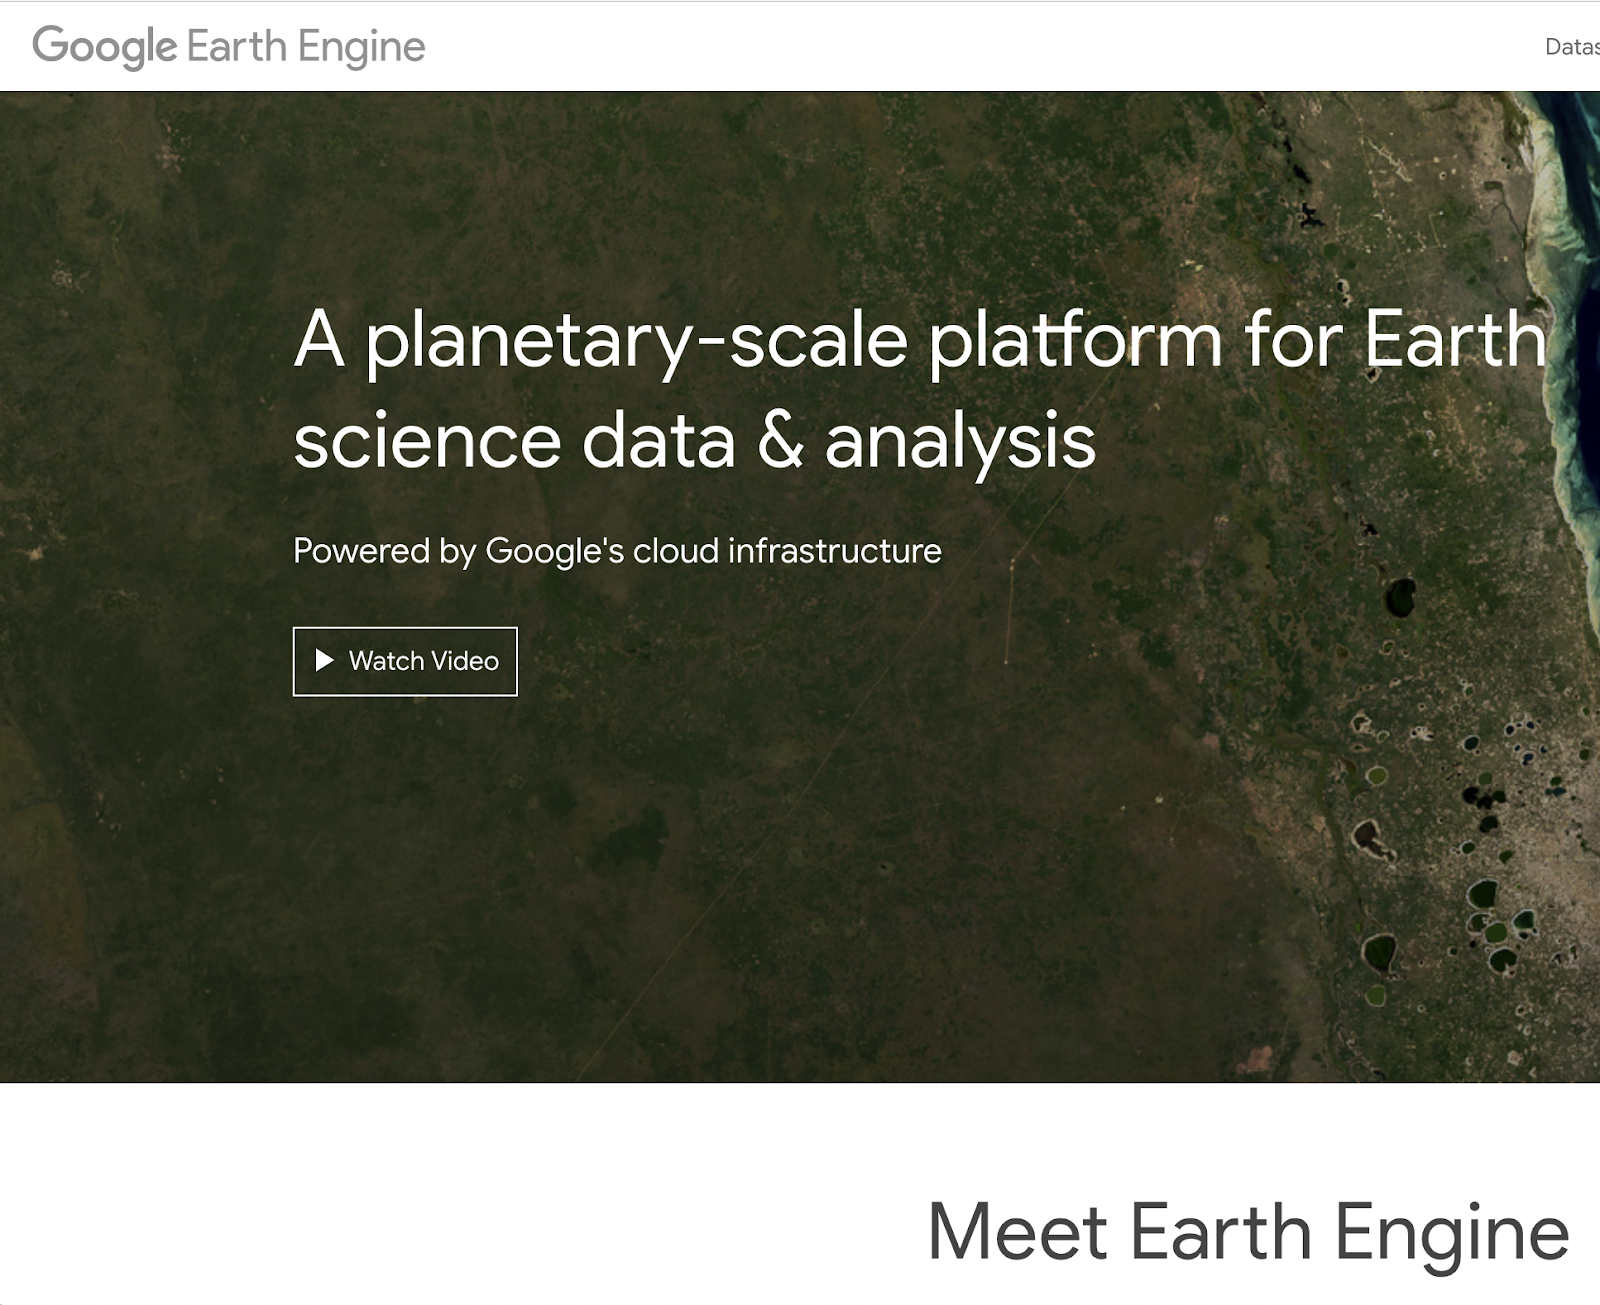
Introduction to Google Earth Engine
Use a multi-petabyte library of satellite imagery and data to detect changes, map trends, and quantify differences on the Earth's surface
Lesson overview
Introduction to Earth Engine
Earth Engine combines a multi-petabyte catalog of analysis-ready satellite imagery and remote sensing data with Google-scale computation, which allows you to perform planetary-scale analysis -- all from within your browser.
Using Earth Engine you can track surface temperature, changes in vegetation coverage and even biodiversity.
- Introduction to Earth Engine
- The Earth Engine Data Catalog
- The Earth Engine Code Editor
- Creating a thumbnail gif
- Exporting a video from Earth Engine
For more Environmental Journalism lessons, visit:
newsinitiative.withgoogle.com/training/course/environmental-journalism
Introduction to Earth Engine
Earth Engine is an incredibly powerful tool for monitoring the environment. The tool has been designed for geographers, scientists and researchers to allow them to quickly access and analyze more than 600 remote sensing datasets, including satellite imagery spanning from the 1970's to today.
Google Earth lets you travel, explore, and learn about the world by interacting with a virtual globe. Earth Engine, on the other hand, is a tool for analyzing geospatial information. You can analyze forest and water coverage, land-use change, or even assess the health of agricultural fields.
To use Google Earth Engine you first have to sign up using a gmail account. Go to signup.earthengine.google.com and follow the steps to sign up for Earth Engine. Applications are reviewed and can take up to a week to be processed.
Once you have signed up and been accepted to use Earth Engine you can begin to explore the tools capabilities.Once you've been accepted, you'll be able to access the Earth Engine Code Editor, the browser-based interactive development environment for Earth Engine analyses: code.earthengine.google.com.
The Earth Engine Data Catalog
Earth Engine has an extensive database of satellite imagery and remote sensing data. The different datasets have all been tagged and each has a ready-to-use code sample that allows you to instantly open it in the Earth Engine Code Editor and begin exploring and analyzing the dataset.
To access the Earth Engines datasets click on that Datasets tab on the Earth Engine homepage or navigate to developers.google.com/earth-engine/datasets/
The Data Catalog gives you a number of options. You can view all datasets, browse by tags, or access datasets based on the satellite program they were created by. Landsat: the longest-running enterprise for acquisition of satellite imagery of Earth. Modis: Moderate Resolution Imaging Spectroradiometer that was launched into Earth’s orbit in 1999. Sentinel: is part of Copernicus is the European Union's Earth observation programme.
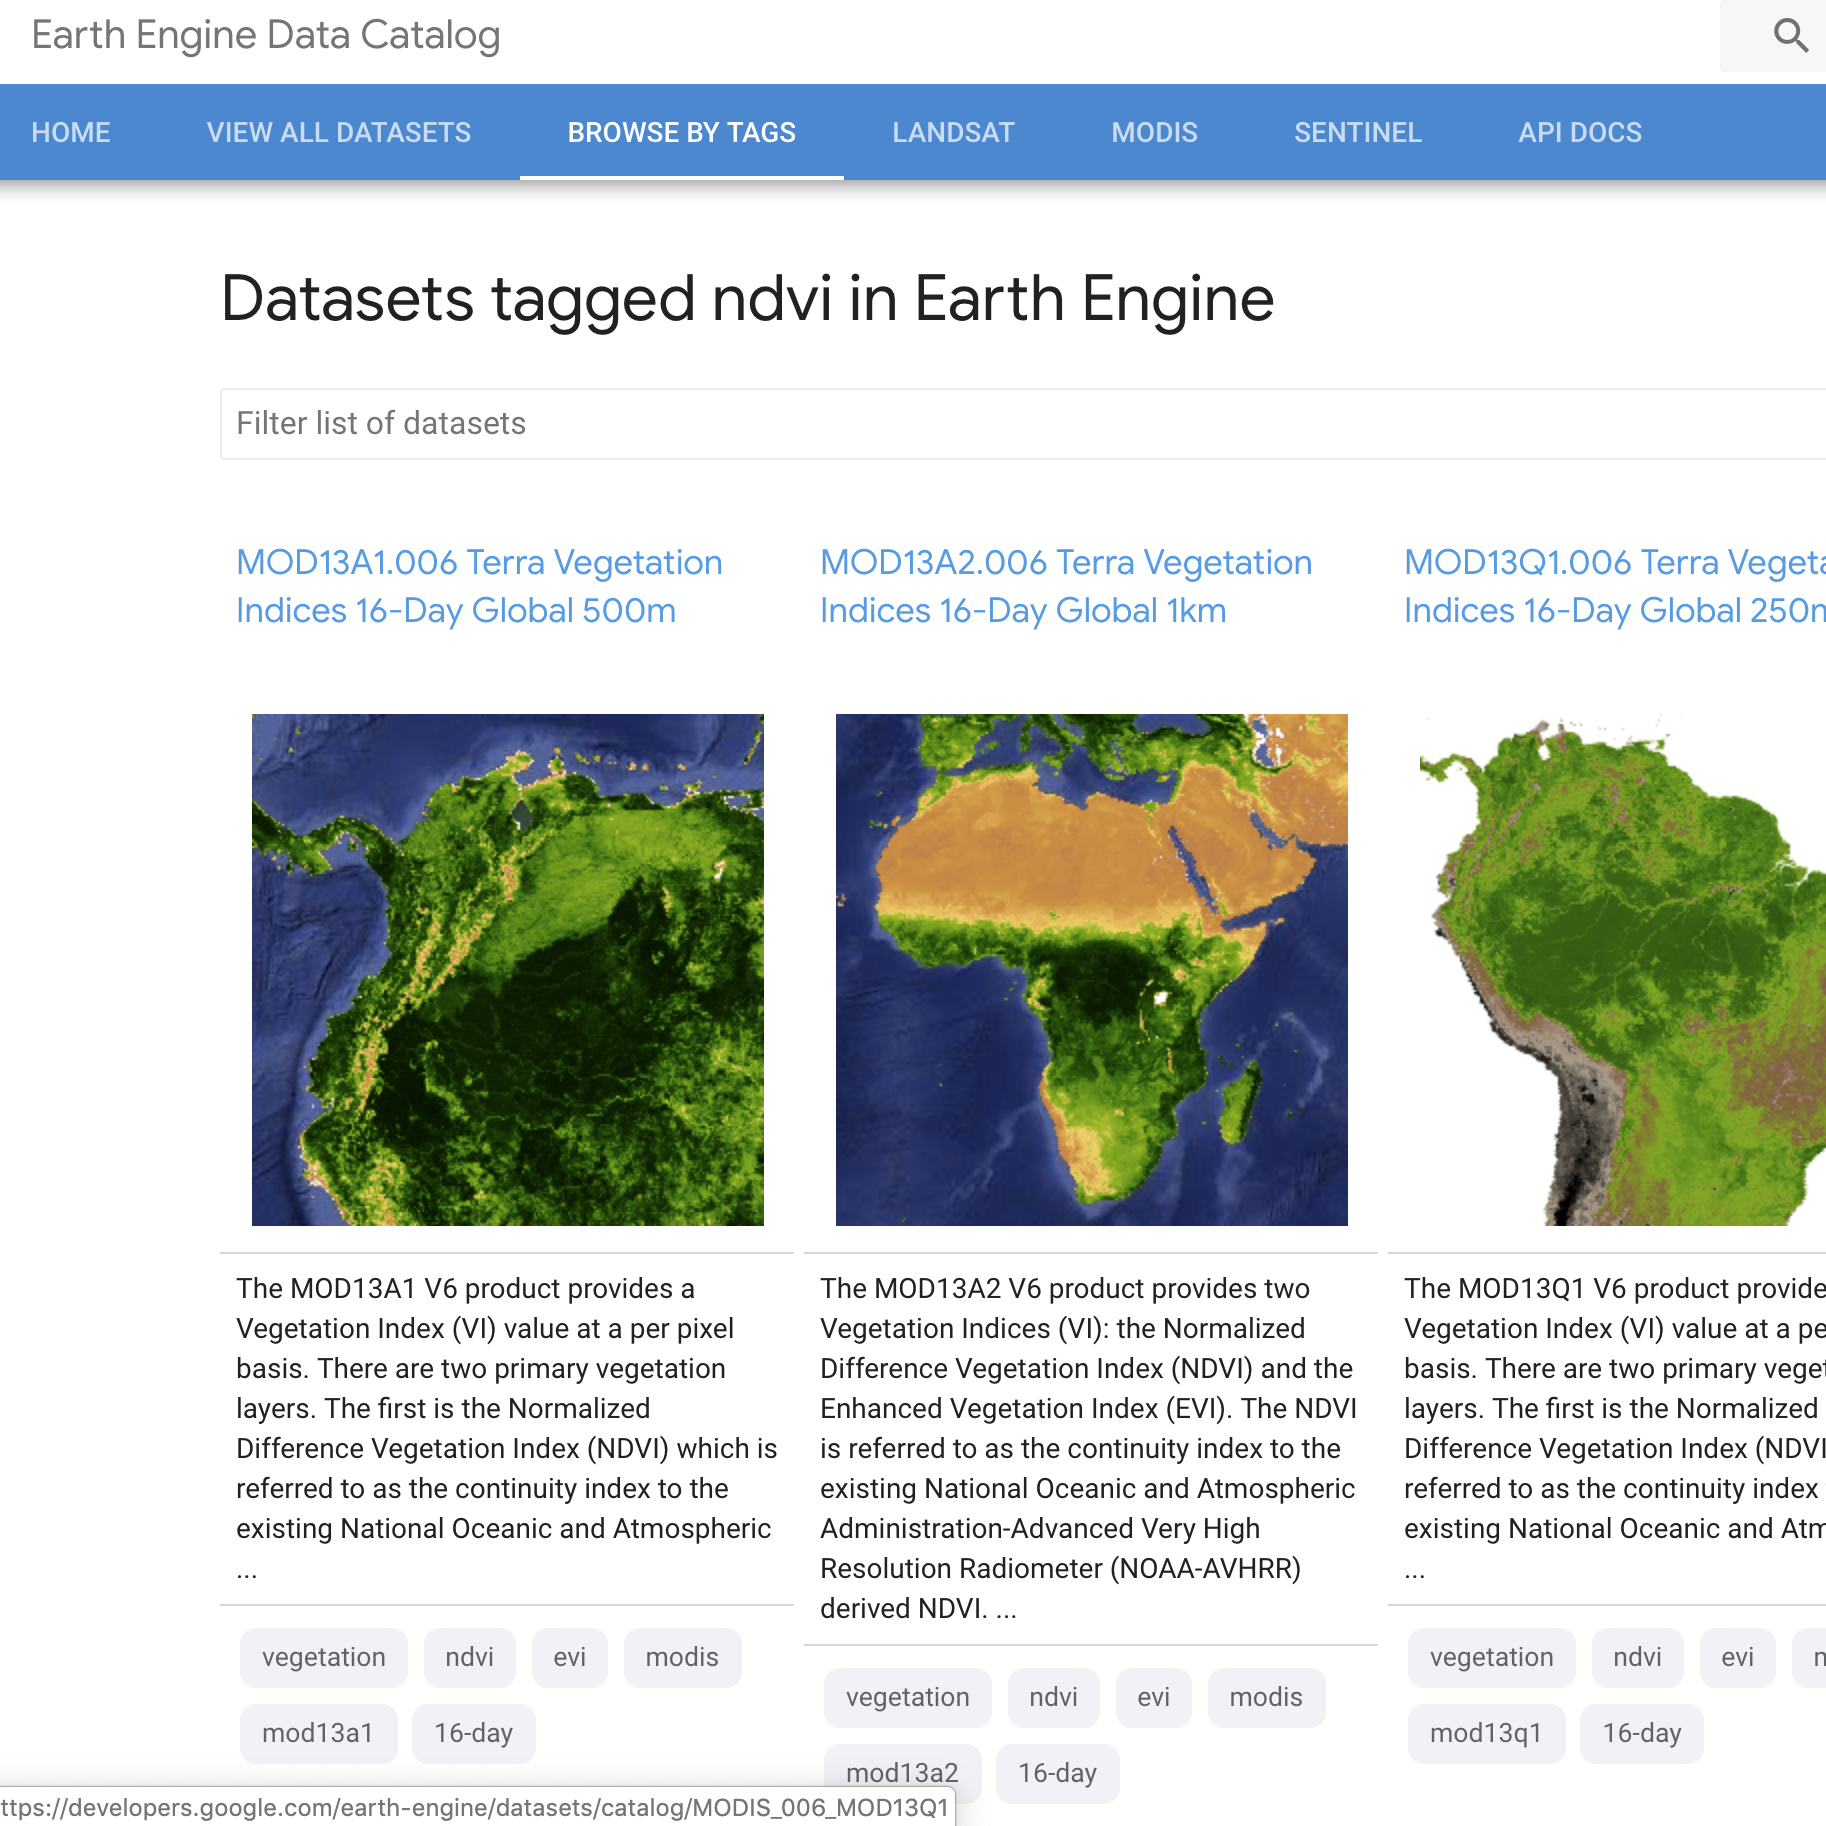
Select ‘Browse by tags’
With in the browse by tags category there is access to all the datasets tagged by where they were produced, what they contain and what they can be used for. Select the NDVI dataset, which stands for normalized difference vegetation index.
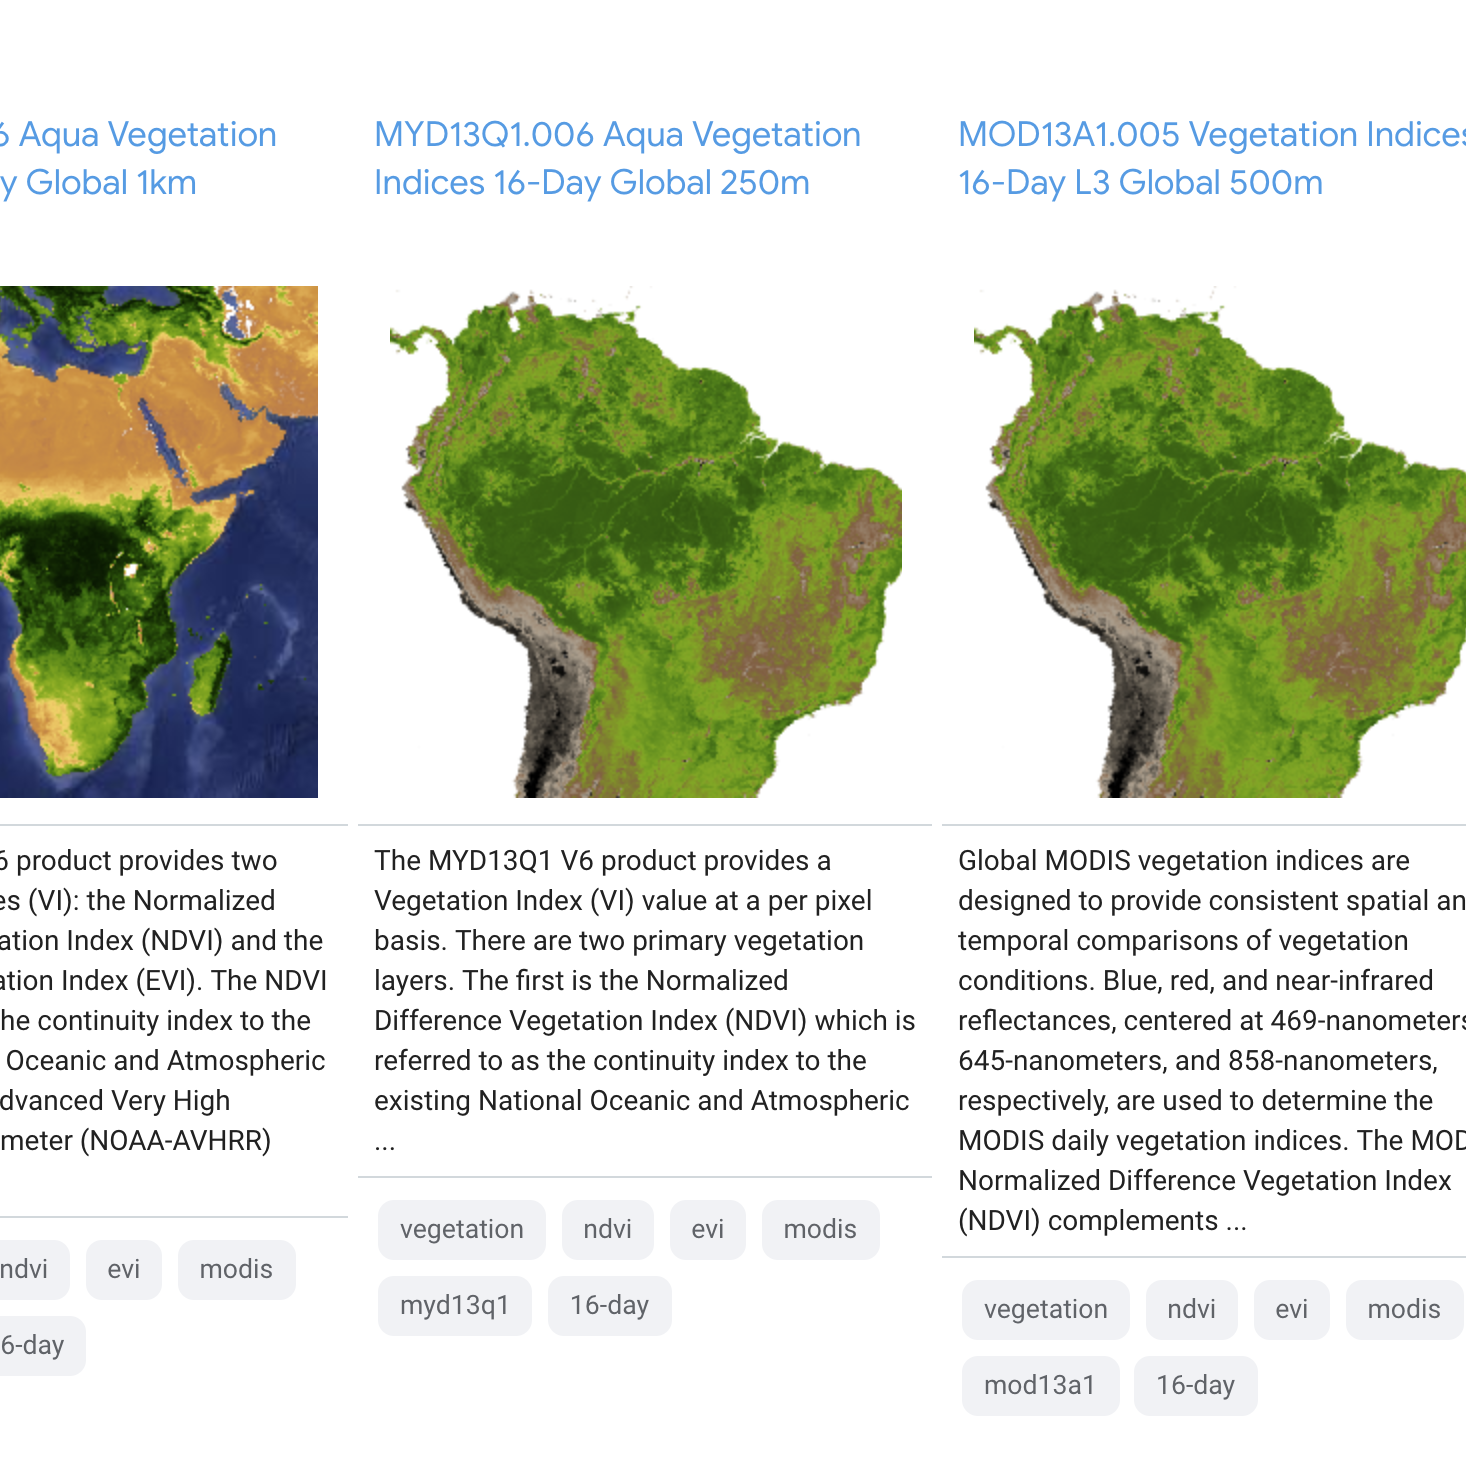
Once you click on NDVI you are taken to a library of all of the datasets which contain NDVI subsets. Each dataset has an image as well as a description of what it contains. Below the descriptions is the list of tags that have been added to that dataset.
Find and click on MYD13Q1.006 Aqua Vegetation Indices 16-Day Global 250m
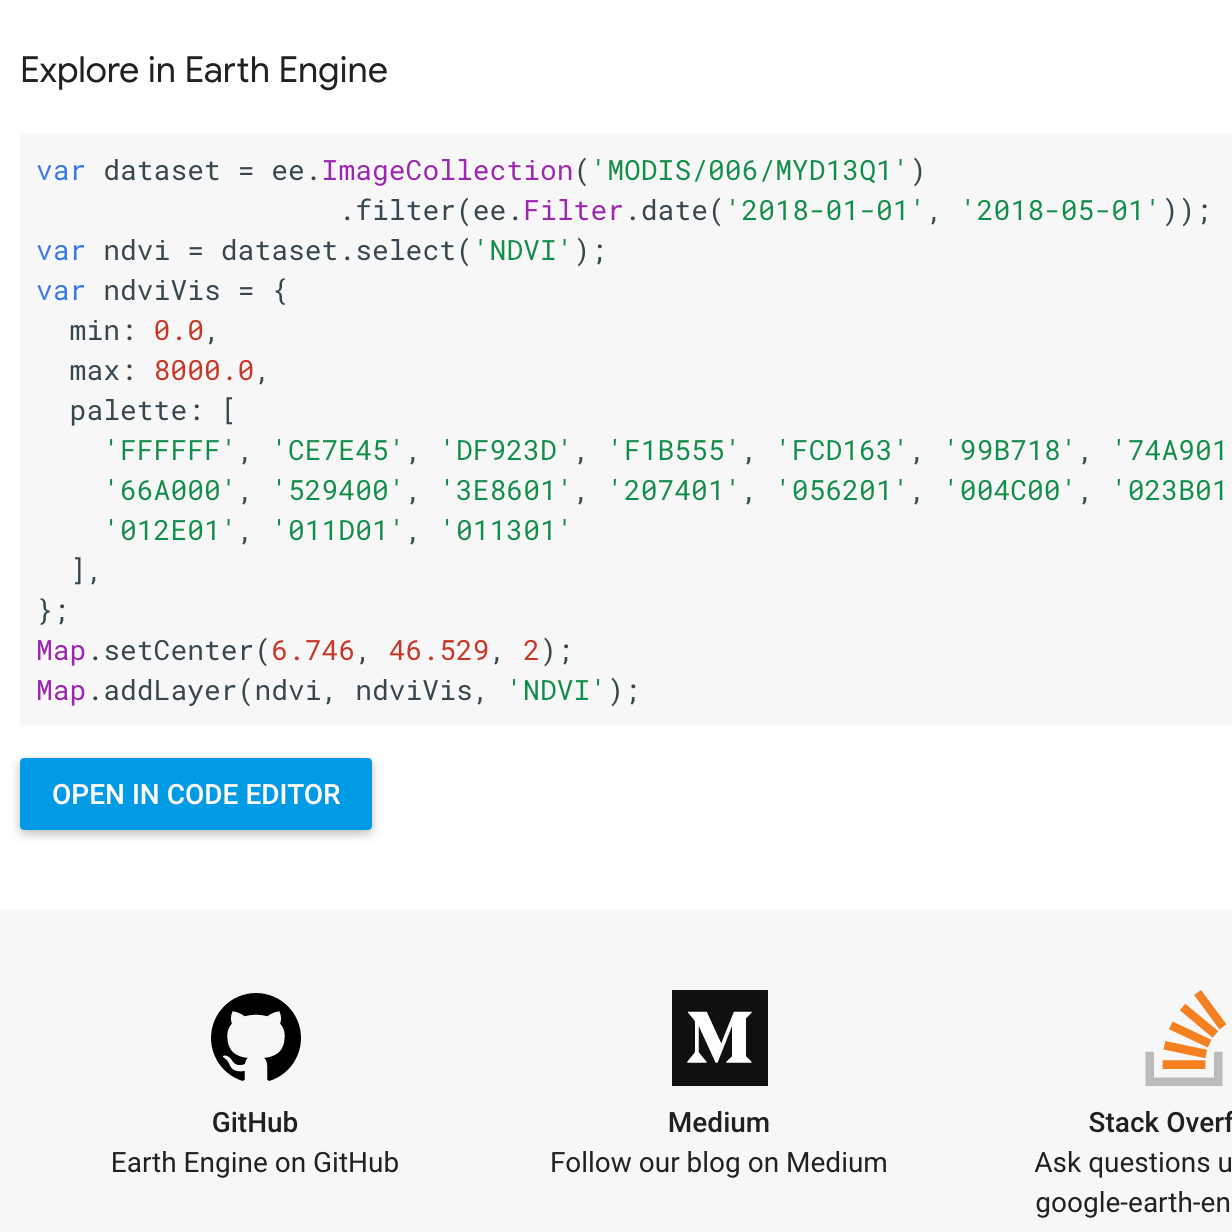
You are now in the dataset. The information box at the bottom contains information on: Bands: the different types of imagery within the set; Terms of use: the licensing; Citations: How to cite the data correctly
At the bottom of the page is a code snippet. This is a javascript snippet that if you click the “OPEN IN CODE EDITOR” button will open a new window with Earth Engine running.
The Earth Engine Code Editor
The Earth Engine Code Editor is a web-based development environment for the Earth Engine JavaScript API. Code Editor features are designed to make developing complex geospatial workflows fast and easy.
The Code Editor allows a user to analyze satellite imagery from the Data Catalog. This powerful tool can be used to analyze, map, chart and even render out videos from the huge catalog of satellite imagery.
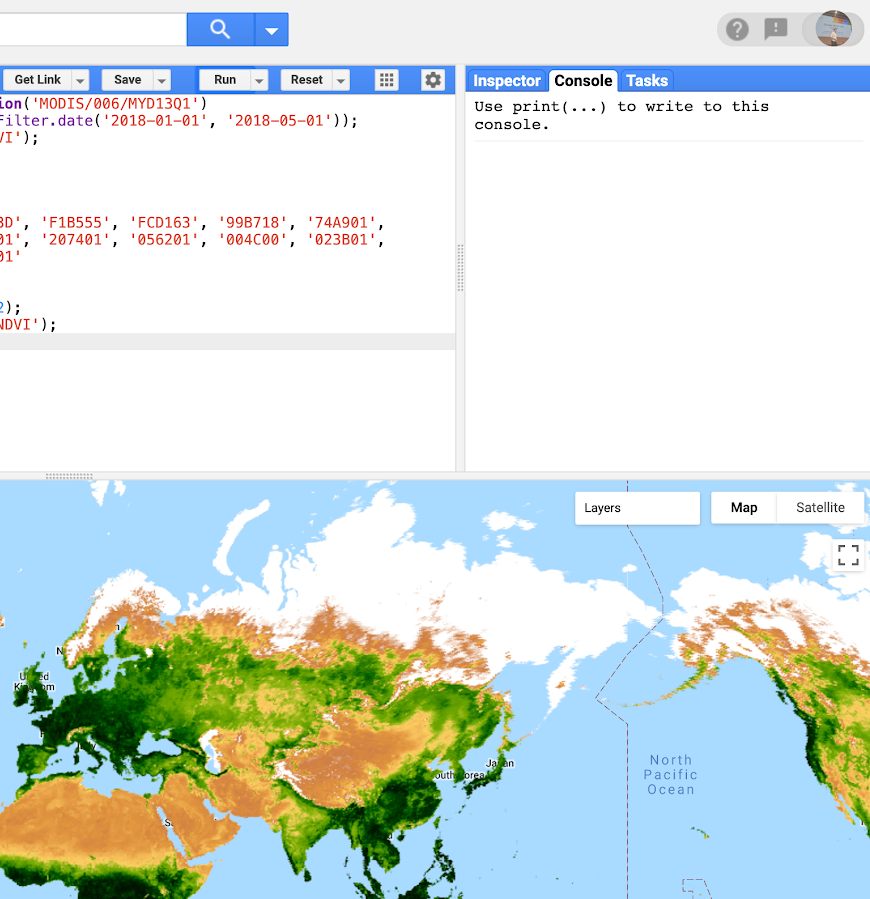
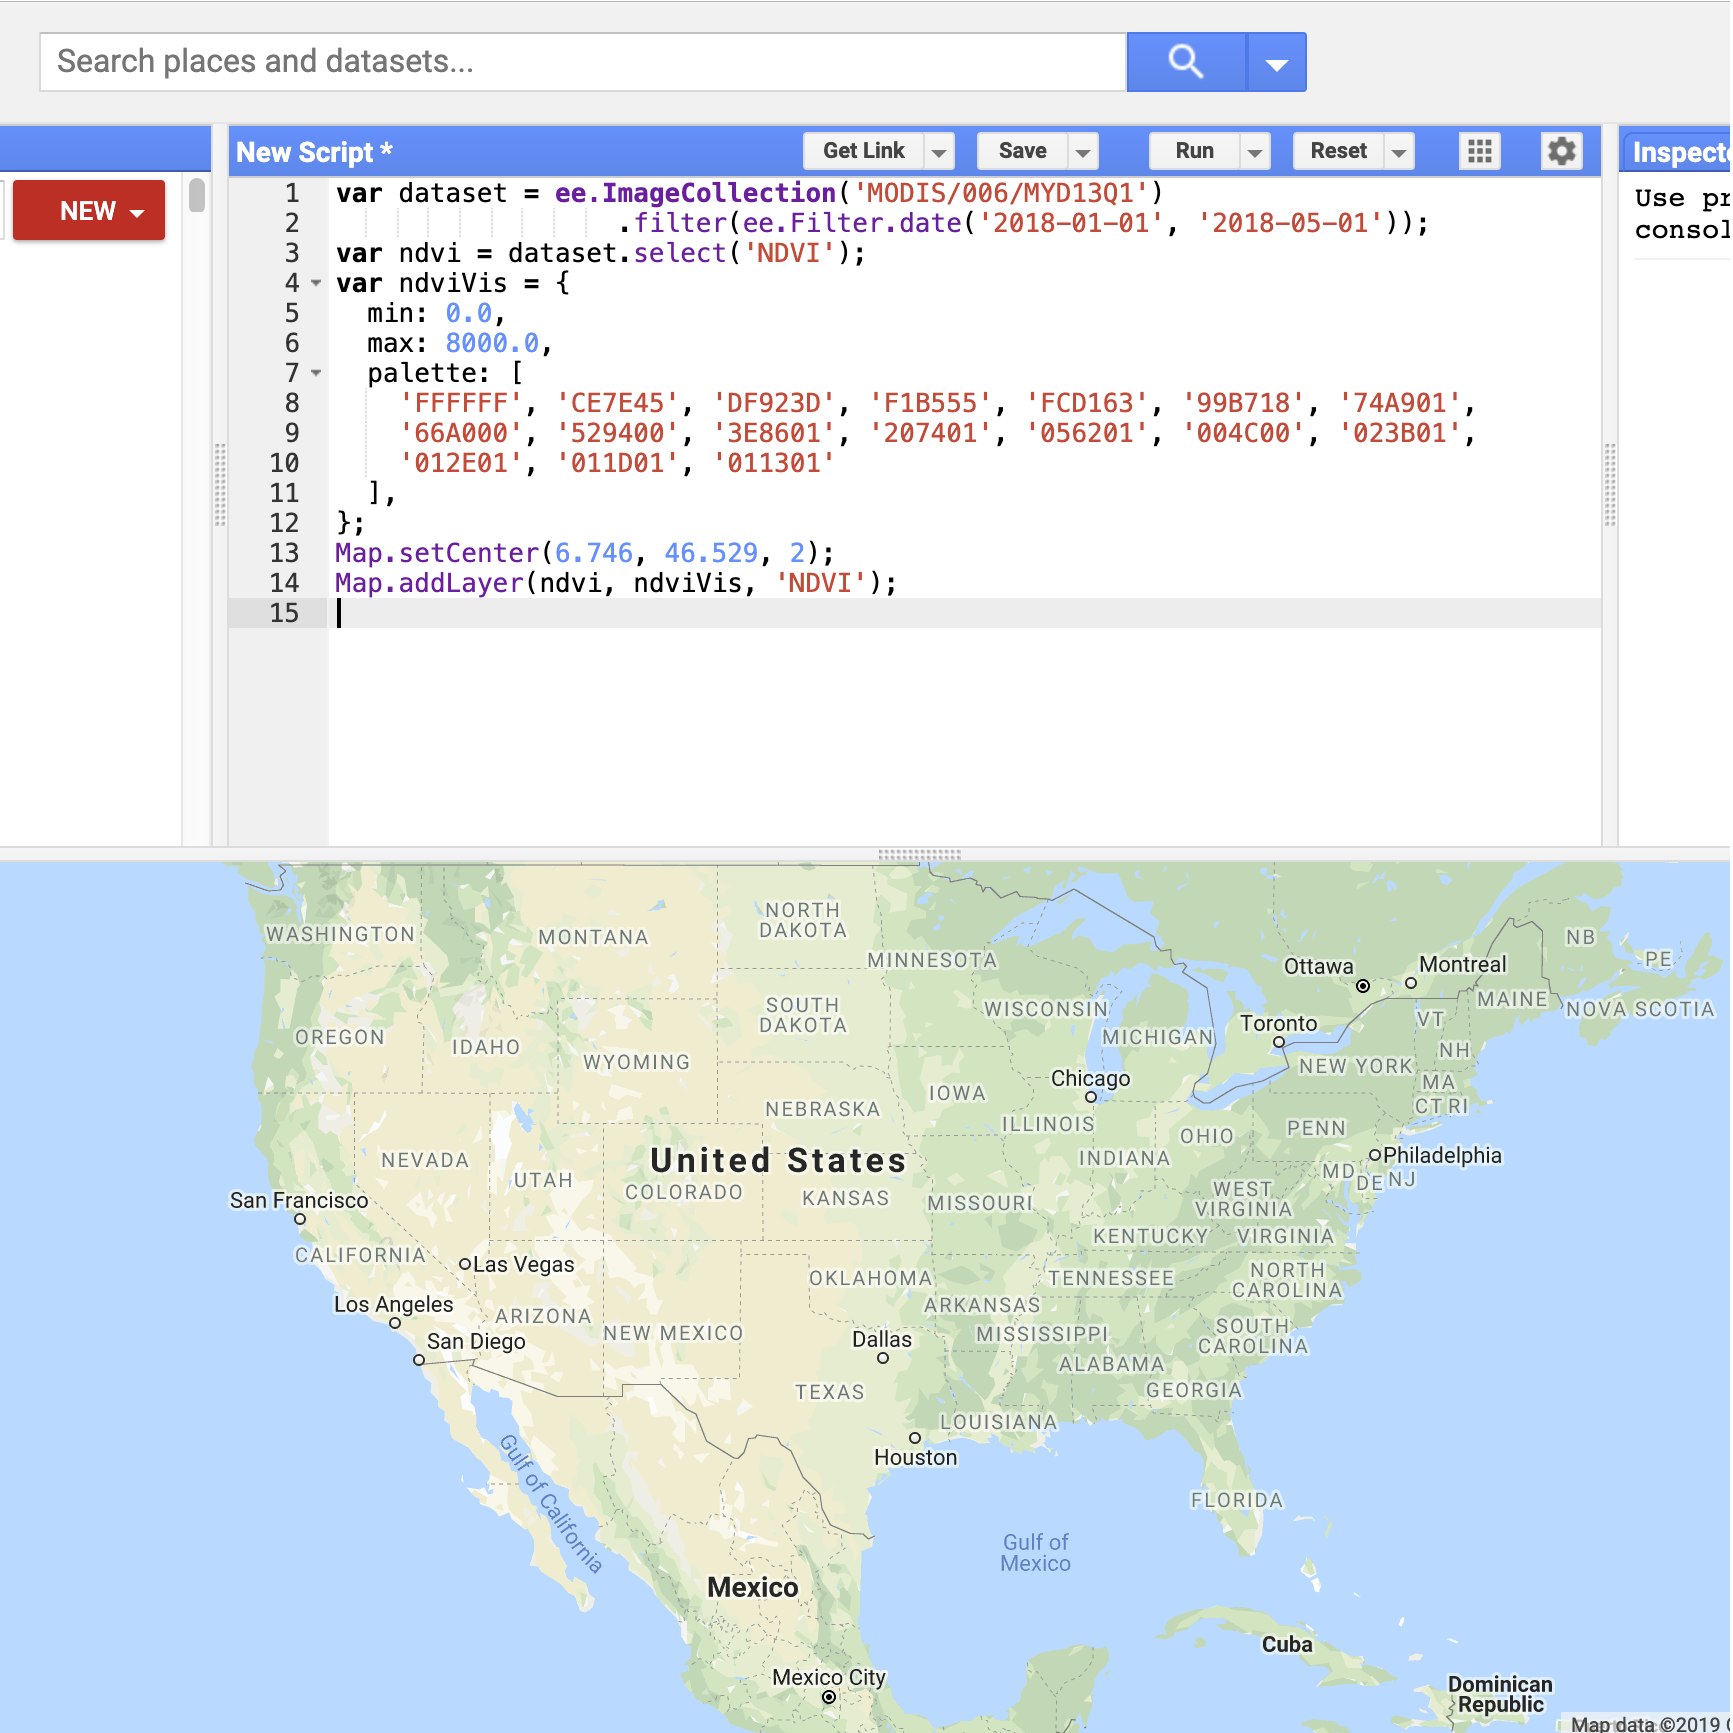
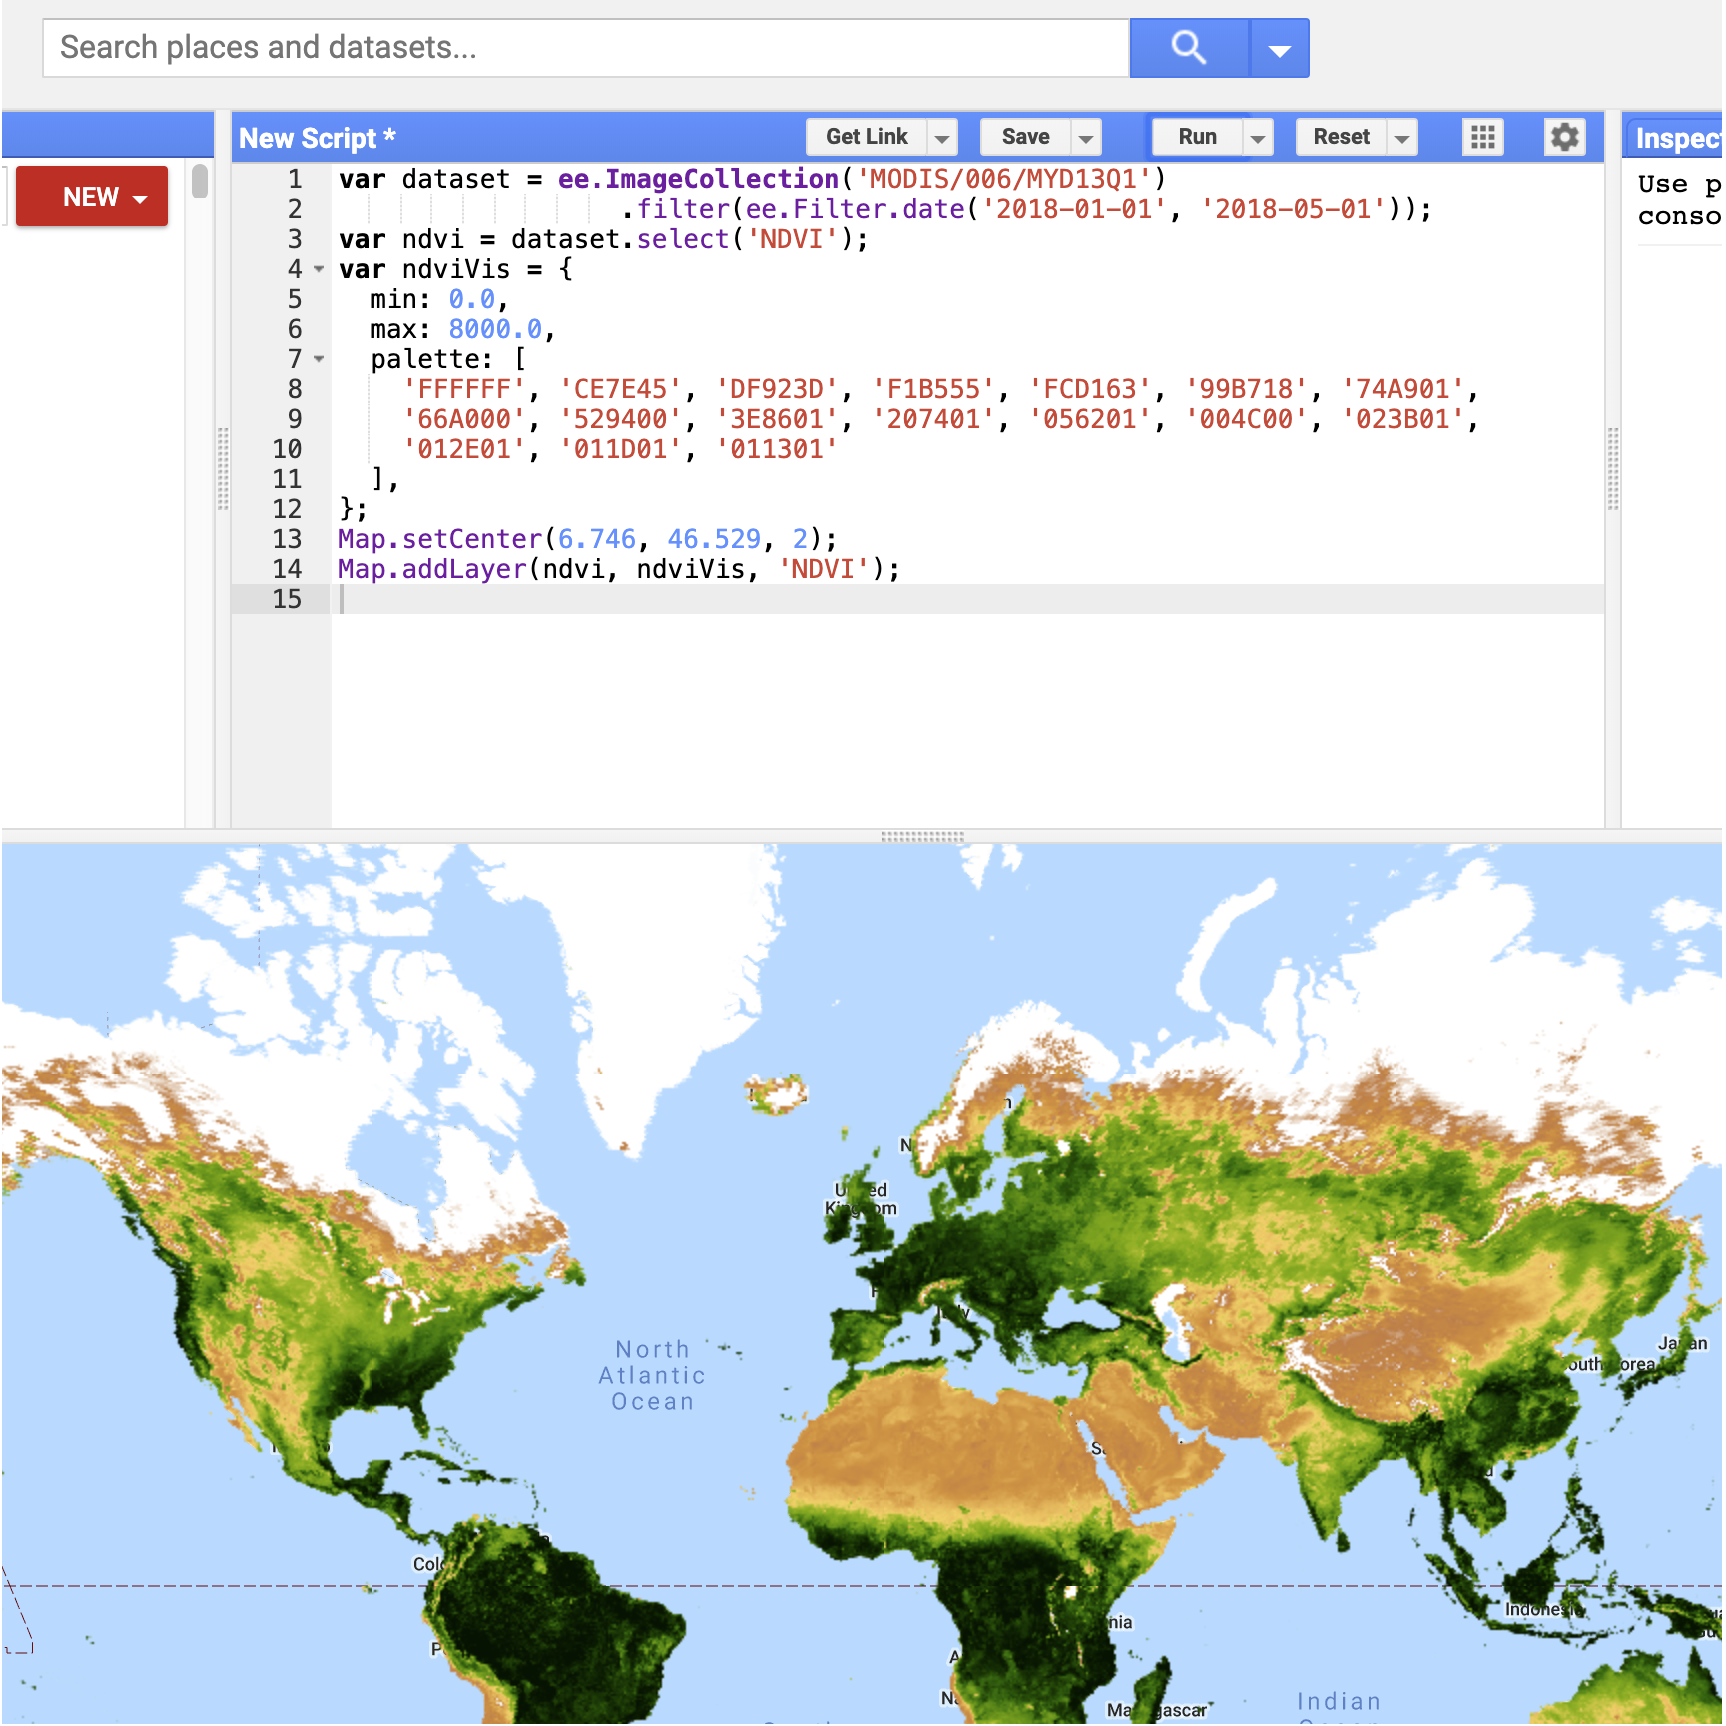
If you have been following our guide you should now have the NDVI data set code sample opened in the code editor. Click on the "Run" button at the top of the editor to execute the code sample, which will render the dataset as a new layer on the world map.
The code editor has now rendered the dataset on to the map. You can zoom in and pan on the map. In addition, by altering the code in the editor you can change the imagery displayed. If you change the dates where it says: .filter(ee.Filter.date('2018-01-01', '2018-05-01'));You can alter the imagery that is displayed on the screen.
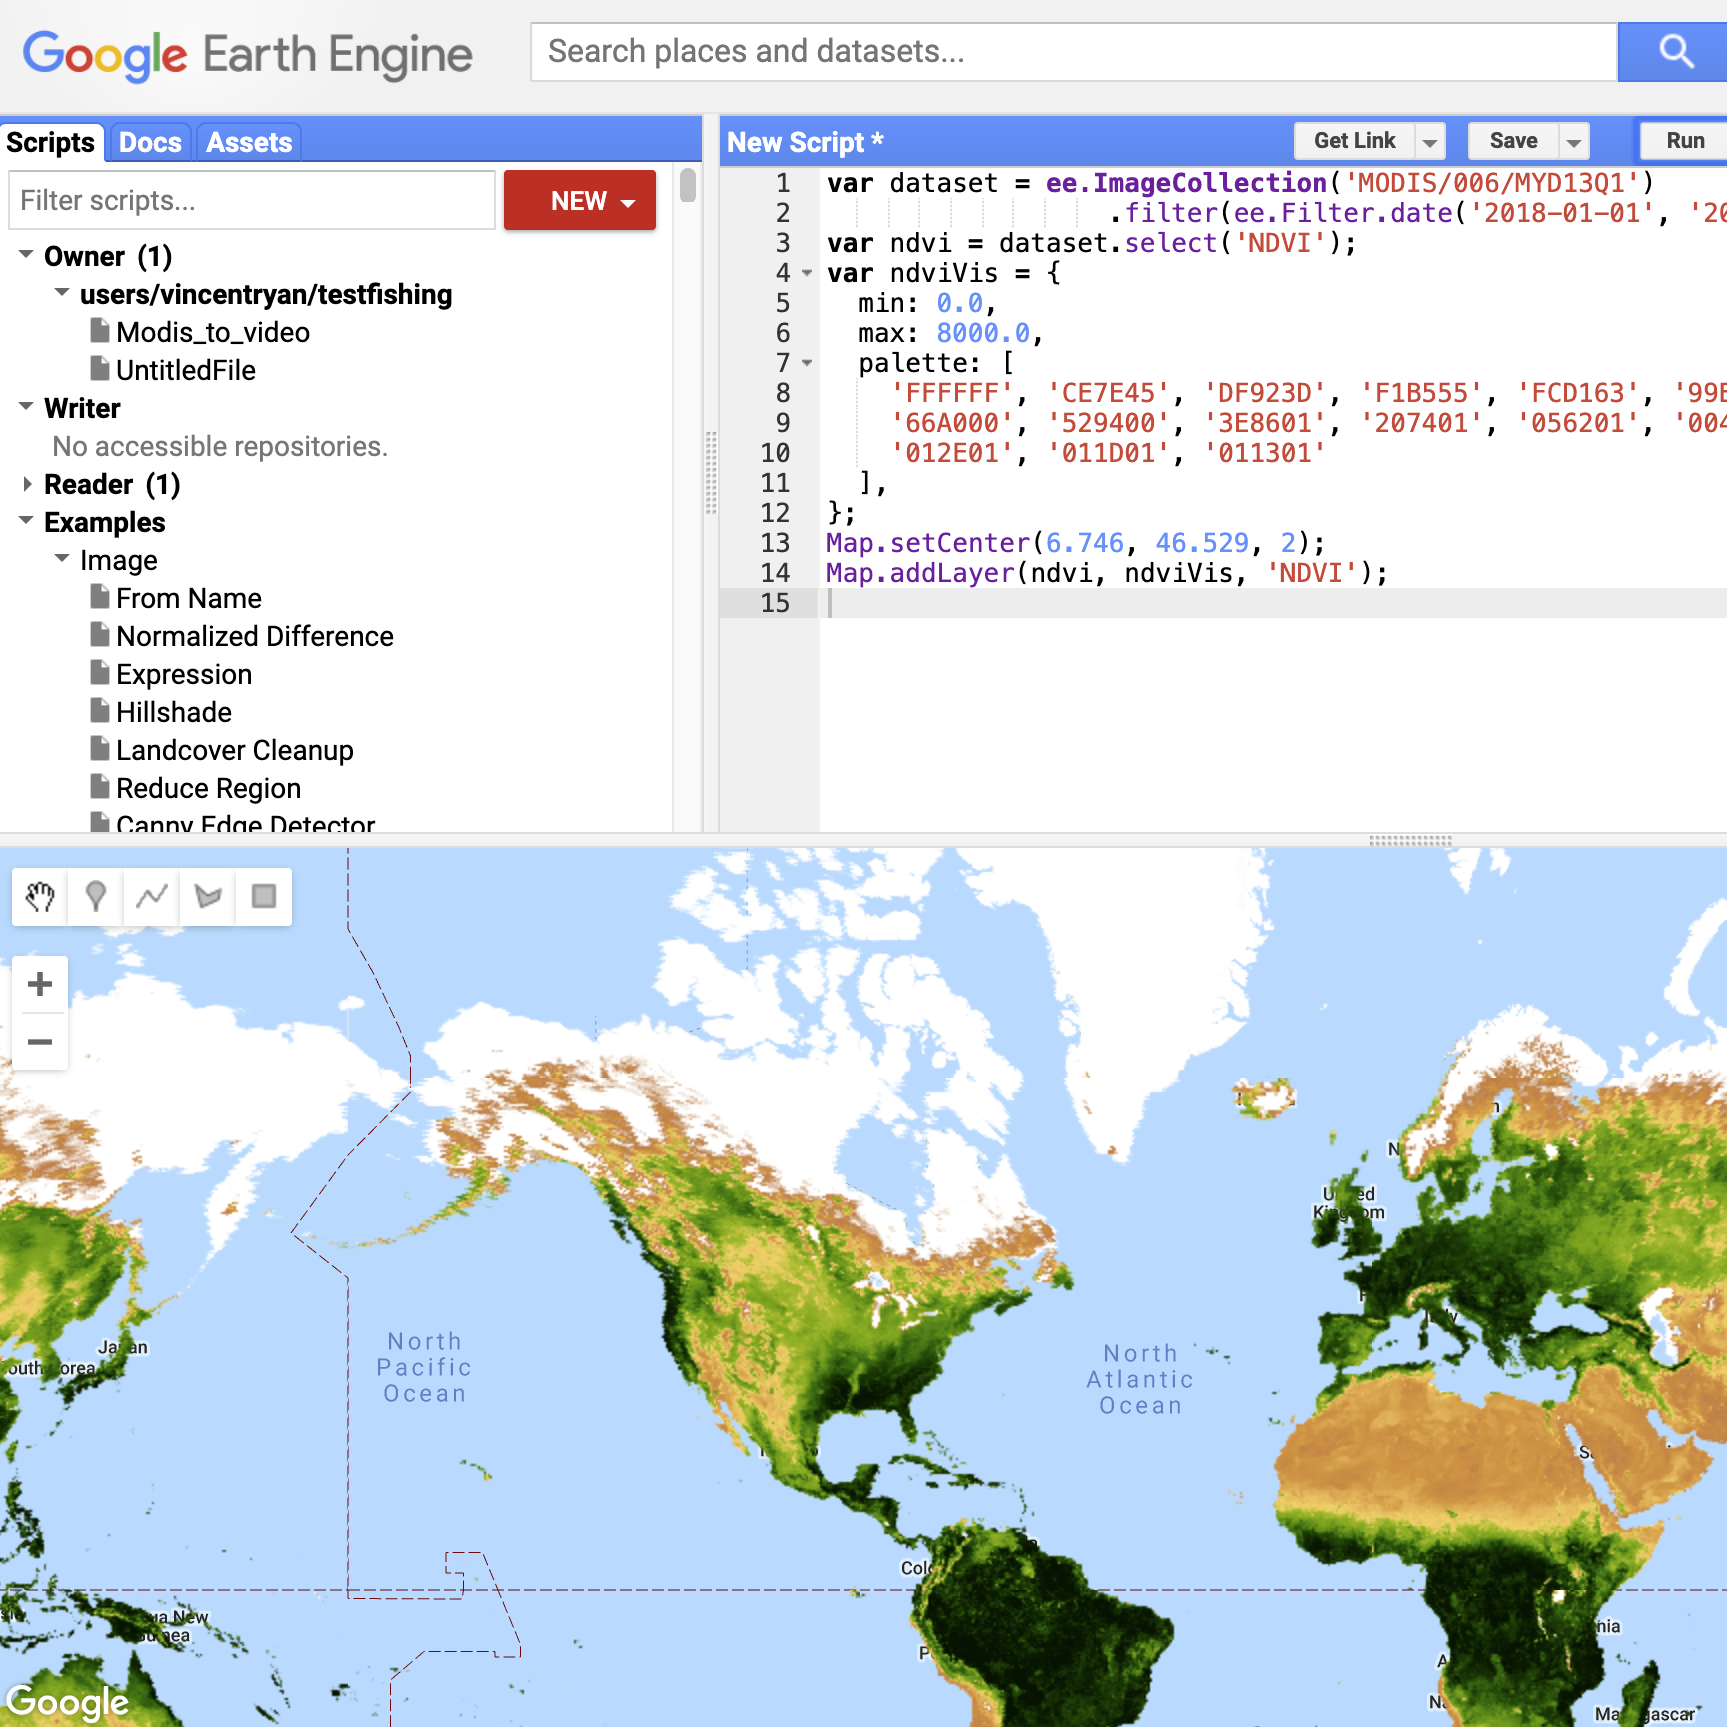
On the left side of the code editor is the Scripts manager. The scripts manager has code snippets that you can run in the editor to enable different features of Earth Engine. You can also save your work here by clicking NEW and then create a repository. Within the repository you can then save, share and track changes of folders and files that you are working on. The full documents on the code editor or available here.
The search box at the top of the code editor allows you to search the Data Catalog. Get Link: Creates a unique link to the script that you are working on so that you can share it with others. ‘Save’ and ‘Run’ do as described while ‘Reset’ clears your code.
On the right of the code editor are the Inspector, Console and Tasks tabs. The Inspector tab allows you to use your cursor to examine the layers visible on the map. The Console tab is where objects appear if you use the print() in the code editor. The ‘Tasks’ tabs handles long computations such as videos, exporting static map tiles, or exporting analysis results as tables, GeoTIFFs, and other formats.
Creating a thumbnail gif
Creating a thumbnail gif within Earth Engine lets you examine the satellite imagery quickly and easily before you choose to render anything to video.
This image on the left tracks the growth and retreat of vegetation in eastern Africa over the course of one year using data from the NDVI imagery we added to the code editor earlier.
First we need to identify the area. Add this code above the dataset:var rect = ee.Geometry.Rectangle({ coords: [[-12, 15], [3, 2]], geodesic: false});Map.addLayer(rect);Map.centerObject(rect, 3);coords = the points of longitude and latitude to highlight. Click run.
Now that we have the area highlighted we need to prepare the images for the GIF animation, using the visualize() method, which converts the native pixel data into 8-bit RGB, suitable for use in exported videos or GIFs:var visualizedCollection = ndvi.map(function(image){ return image.visualize(ndviVis)})var firstImage = ee.Image(visualizedCollection.first());map.addLayer(firstImage, {}, "first image");
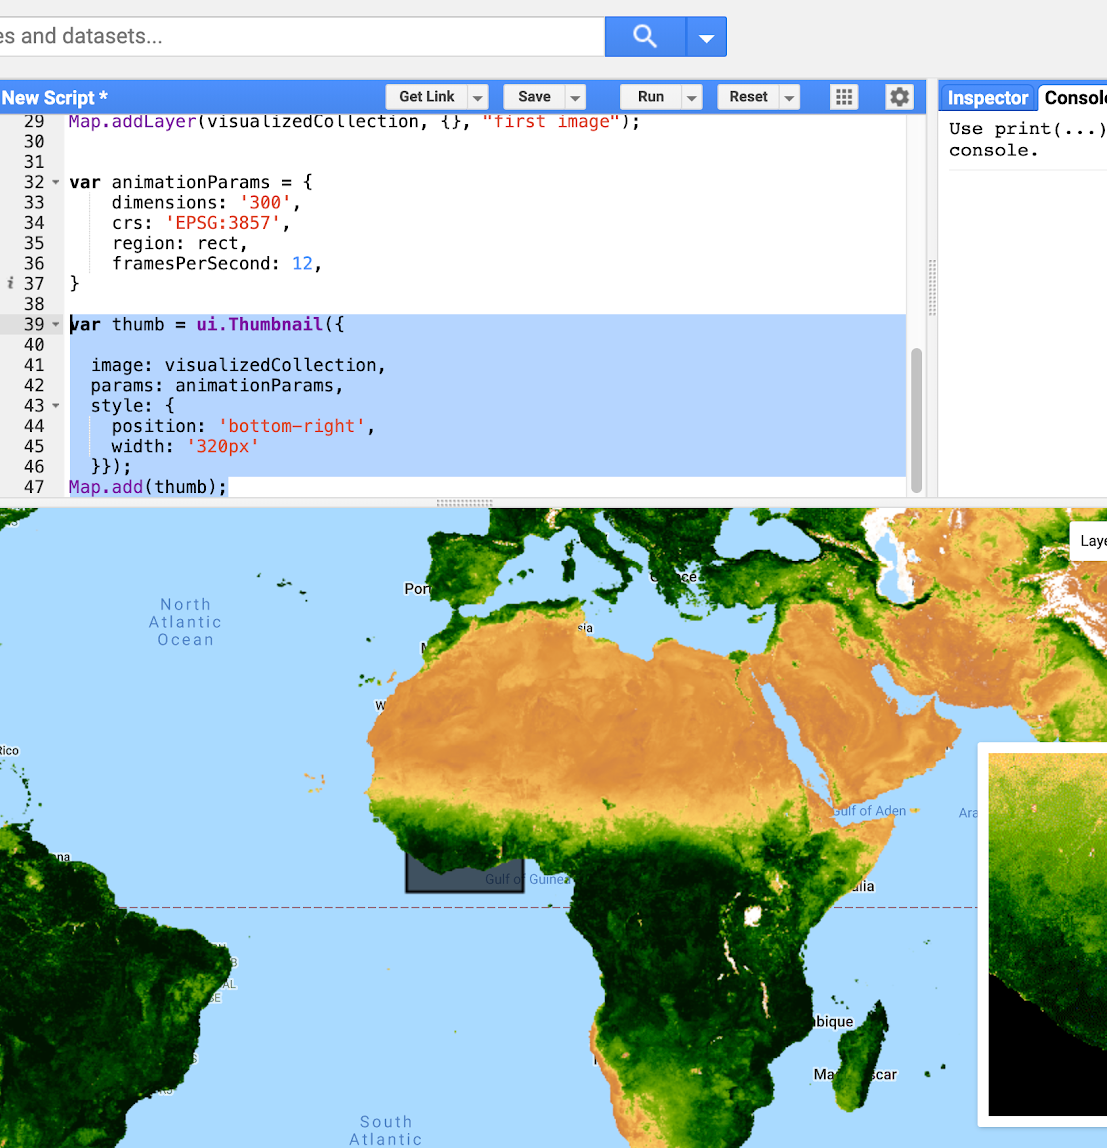
The second to last step is to specify the parameters for the animation:var animationParams = { dimensions: '300', crs: 'EPSG:3857', region: geometry, framesPerSecond: 12,}
The final step is to create the thumbnail image and add it to the map:var thumb = ui.Thumbnail({ image: visualizedCollection, params: animationParams, style: { position: 'bottom-right', width: '320px' }});Map.add(thumb);Click Run
Export a video from Earth Engine
Earth Engine allows you to render video directly out to your drive. While the thumbnail is limited to a short number of frames, by rendering to video you can create high resolution satellite video over a long time period.
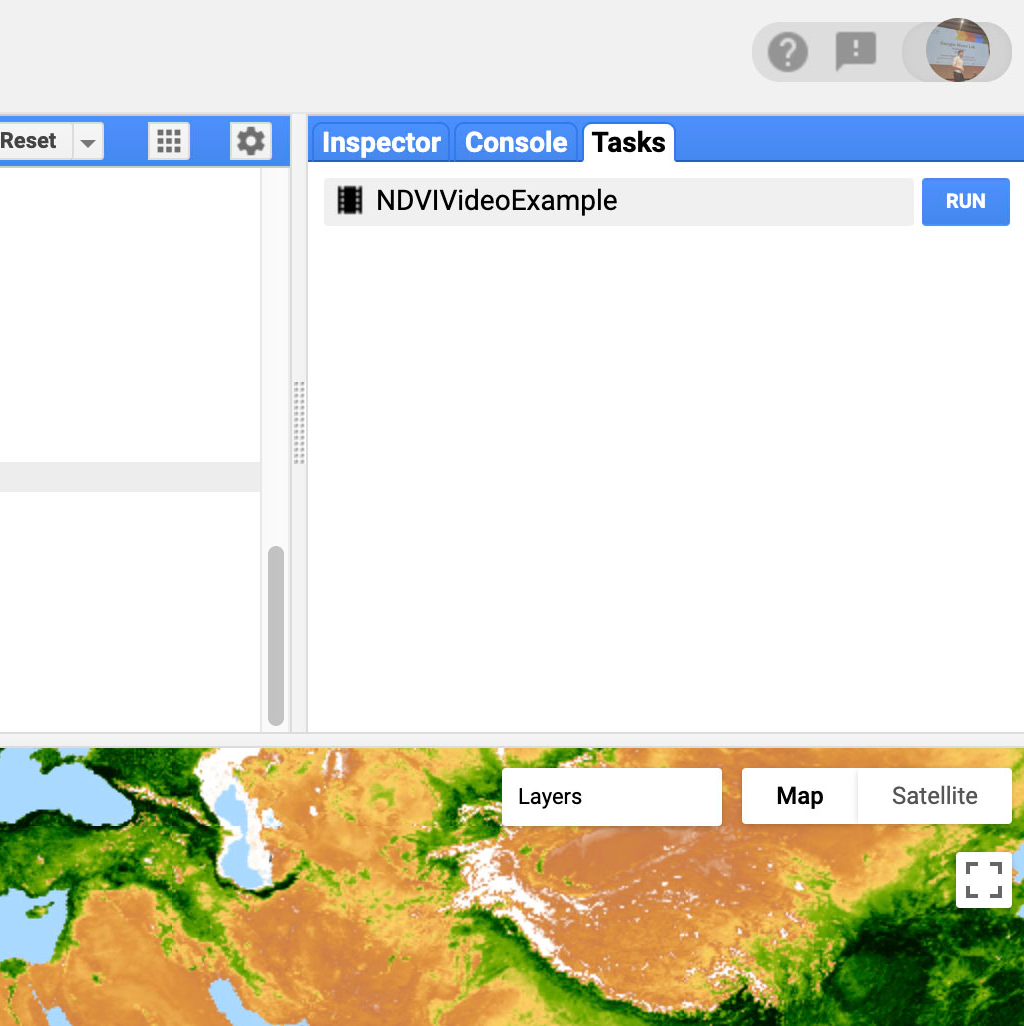
To export to video add the following code:Export.video.toDrive({ collection: visualizedCollection, description: 'NDVIVideoExample', dimensions: 720, framesPerSecond: 12, region: rect});Click Run
As you are rendering out to a video this operation is created as a Task. If you go to the Tasks tab you will have created a Task that needs to be run to create the video. Once you click ‘Run’ a video will be rendered to your drive.This link here will take you to saved version of this scriptNote: Batch exports can take some time to complete. You can check the status of the export by looking at the Tasks tab. When the task completes, it will change color to blue.
Congratulations!
You completed “Introduction to Google Earth Engine.”
To continue building your digital journalism skills and work toward Google News Initiative certification, go to our Training Center website and take another lesson:
For more Environmental Journalism lessons, visit:
newsinitiative.withgoogle.com/training/course/environmental-journalism
-
![image27_1_m4XKLu5.png]()
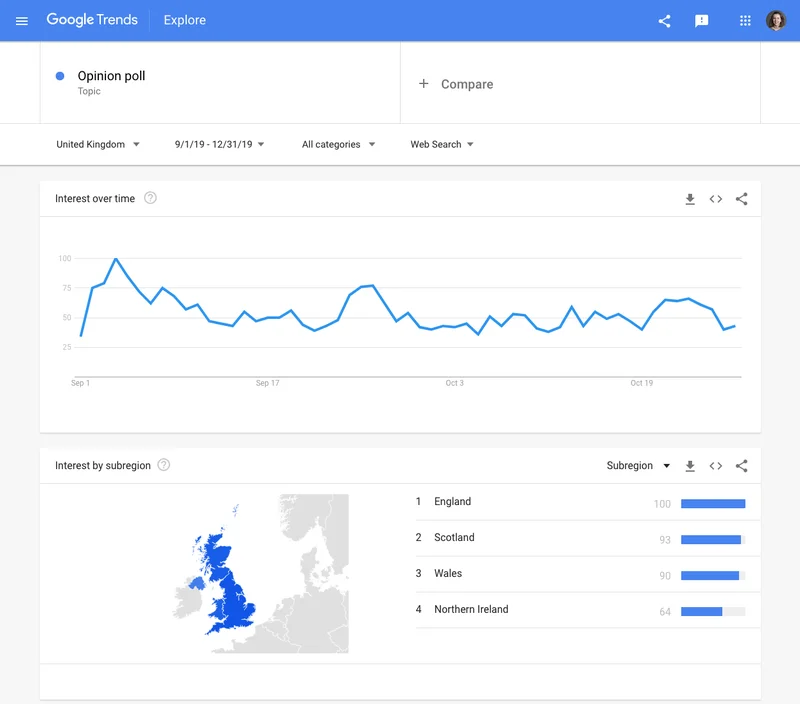
Covering politics with Google Trends
LessonIn this module, we will look at ways to use Google Trends to analyze searches specifically related to politics. -
![LookingAheadToML-PoweredJournalism]()
Looking ahead to ML-powered journalism
LessonKey learnings and recommended resources to deepen your ML knowledge. -
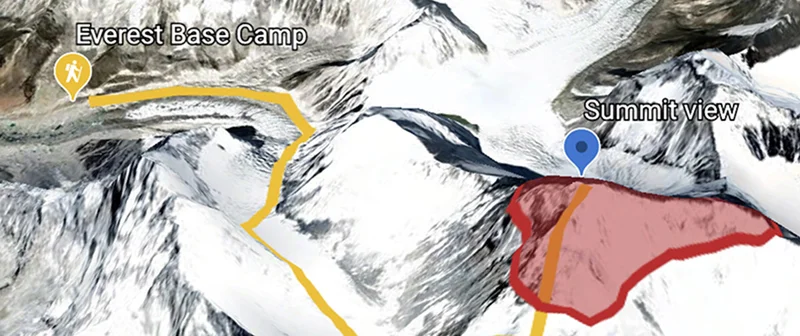
![GoogleEarthCreationTools_TellYourStoryAcrossTheWorld]()
Google Earth creation tools: Tell your story across the world
LessonHow to use Google Earth to create compelling stories