Build your audience with Realtime Content Insights

See how your articles are performing, in real time
See how your content performs with Realtime Content Insights
What news do your audiences care about?
Realtime Content Insights analyzes your Google Analytics data to help you discover:
- Your best stories, in real-time and historically
- The stories your most engaged audiences read
- What people near you are searching for on Google and watching on YouTube
To use Realtime Content Insights, you need a Google Analytics account.
- Go to Realtime Content Insights.
- Select Authorize.
Select your Google Analytics account.
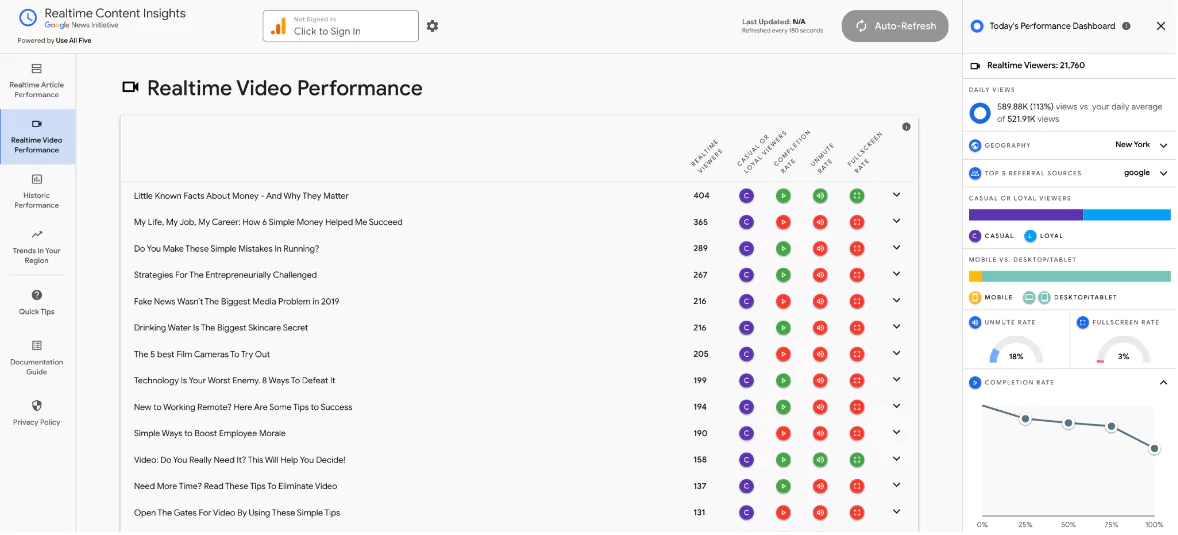
See what people are reading in Realtime Article Performance
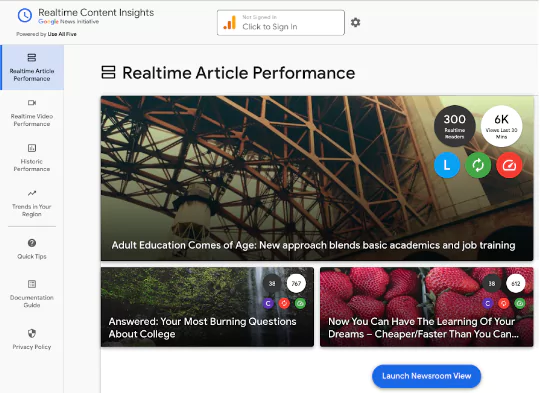
Realtime Article Performance shows you metrics in real time, and refreshes every 180 seconds.
STEP 1
Go to Realtime Article Performance to see a dashboard of your top five articles by realtime readers.
STEP 2
Click Launch Newsroom View to see a dashboard of your top ten articles that you can display in a newsroom.
STEP 3
See how each article is performing by:
- How many readers are reading the article, right now
- How many pageviews an article had in the last 30 minutes
- Which articles were read by Casual Readers vs. Loyal Readers
- Recirculation: does this article lead to more articles being read?
- Page Speed: which articles are slowing your site down?
Track daily performance with Today’s Performance Dashboard
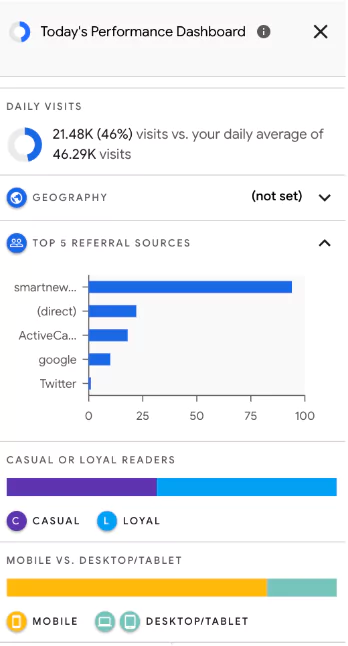
Today’s Performance Dashboard shows your articles’ metrics for the day, compared to your last 7 days.
STEP 1
Go to Realtime Article Performance
STEP 2
Click the menu next to Today’s Performance Dashboard
STEP 3
View these metrics for today:
- How many readers are on your site, right now
- How many times they’ve visited, compared to your daily average
- What five traffic sources bring in the most traffic
- What percentage of visitors are Casual Readers (new visitors) vs. Loyal Readers (returning visitors)
- What devices your visitors are on
See which articles have done best with Historic Performance
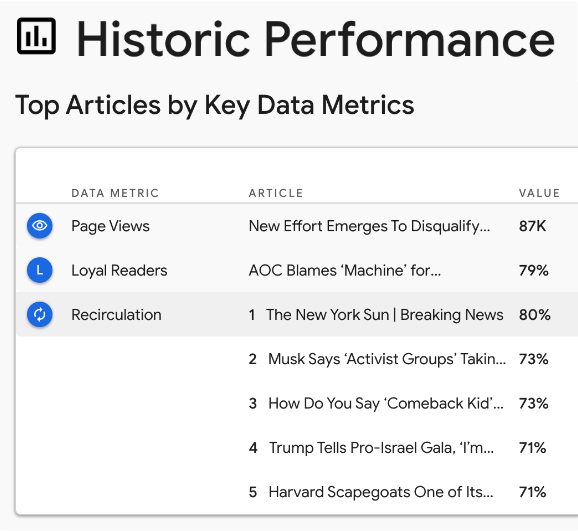
Data metrics shows your top stories based on pageviews, which are read by returning audiences, and which stories refer the most traffic to other stories on your site.
STEP 1
Go to Historic Performance.
Article Performance shows you the top 5 articles not just by pageviews, but that result in the most newsletter sign-ups, shares on social media, and more articles read.
STEP 2
Go to Top Articles by Key Data Metrics
STEP 3
Go to pageviews, Loyal Readers, or Recirculation to see the top 5 articles.
Explore what people are searching for with Realtime Search Trends
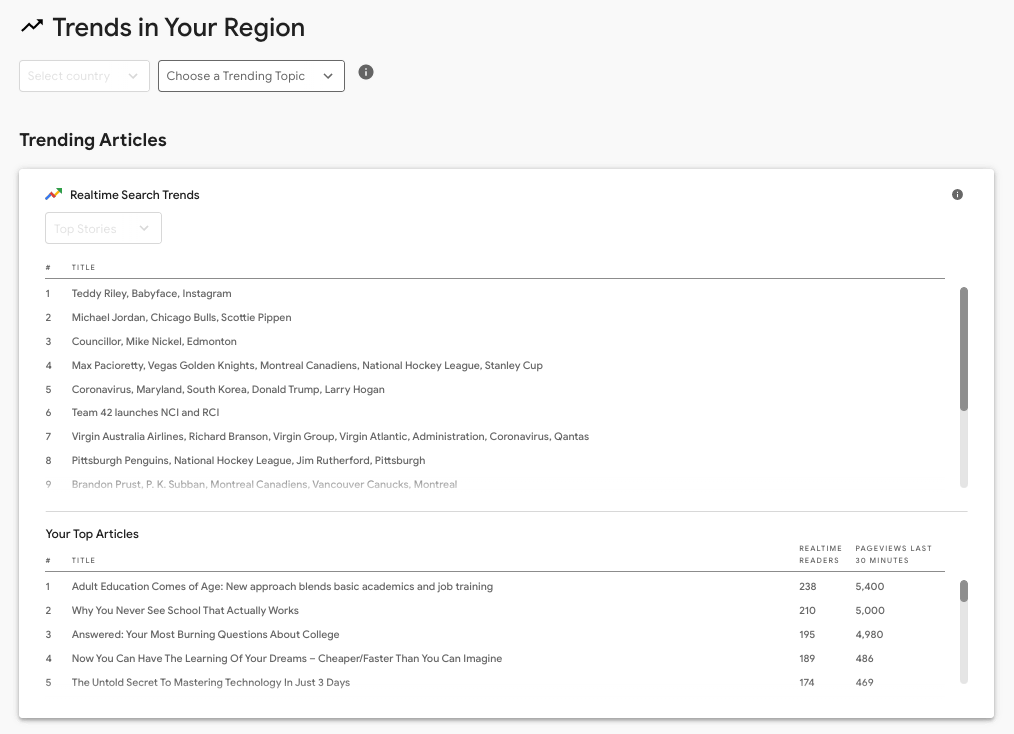
Realtime Search Trends uses Google Trends to show you a summary of actual search requests made to Google, and displays interest in a topic around the world or down to city-level geography.
STEP 1
Go to Trends in Your Region.
STEP 2
In Trending Articles, see the top news stories from the last 24 hours, selected from Search, Google News, YouTube, and Knowledge Graph.
STEP 3
In Trending Videos, see the top news videos from the last 24 hours on YouTube.
💡Best practice: In Google Trends, find “Breakout” searches, which are terms that have grown by more than 5000%!
-
![gni_business_lesson_play_13]()
Build your audience with News Consumer Insights
LessonGet data-driven recommendations for your site -
![gni_business_lesson_play_16]()
Build your audience with Google's analytics tools
LessonMake better decisions based on your audiences’ data