Visualizing Data: Advanced Tilegrams.
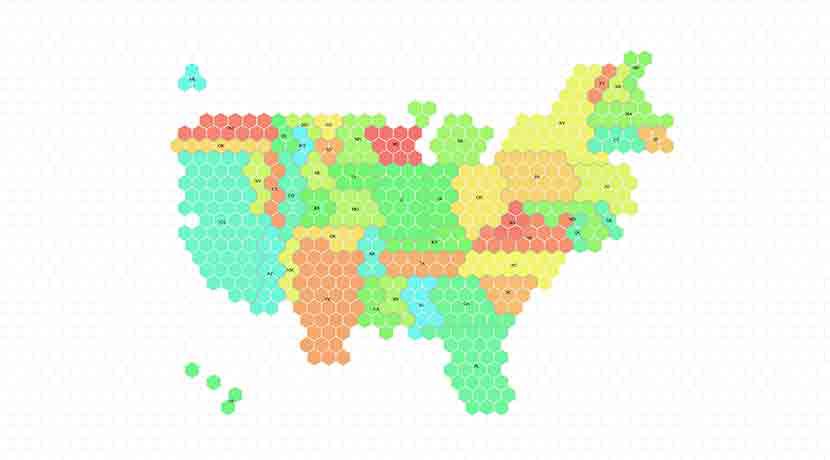
Generate your own Tilegram from data.
Generating new Tilegrams.
You can produce a truly custom Tilegram by modifying the data in the available base maps or by uploading your own data.
Starting with data.
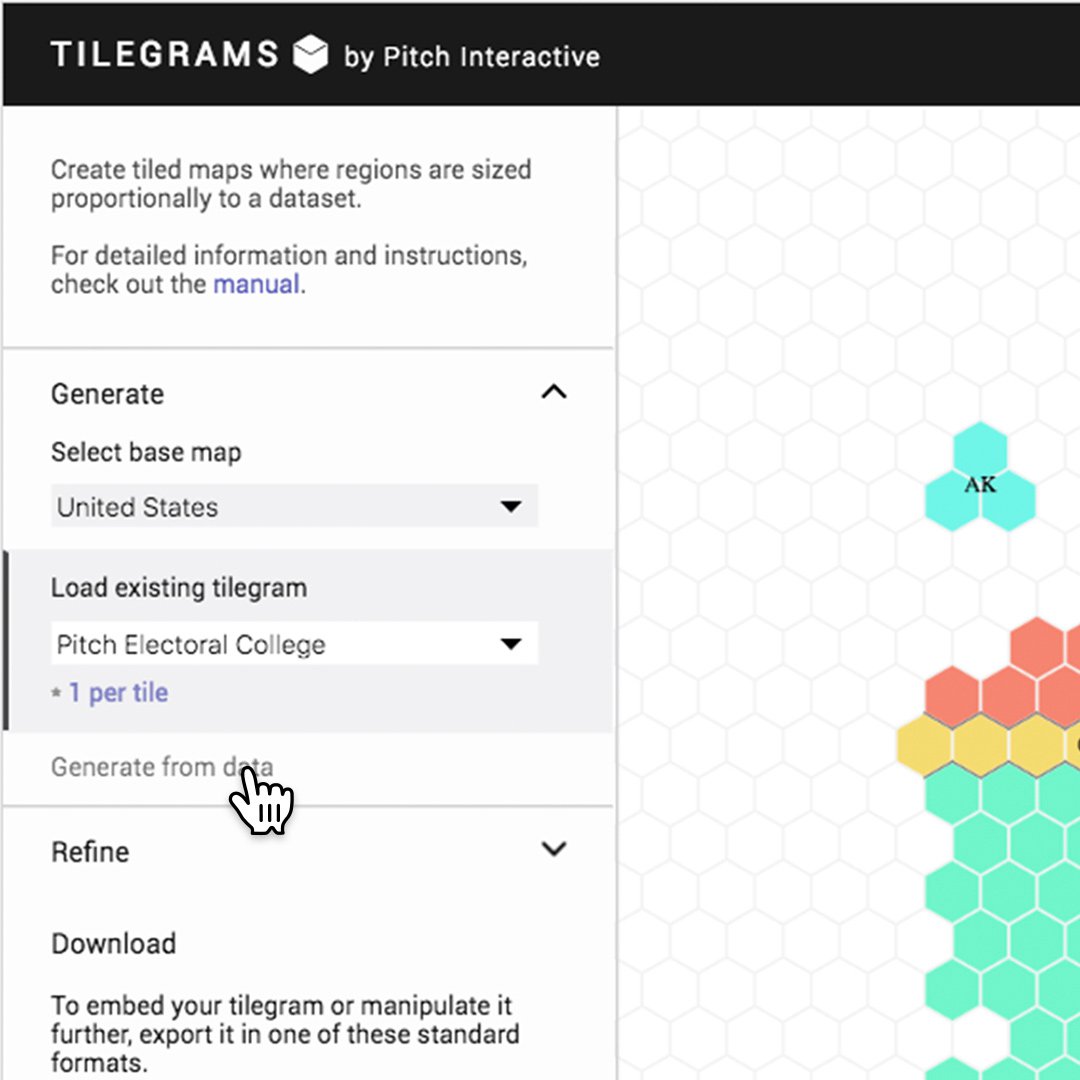
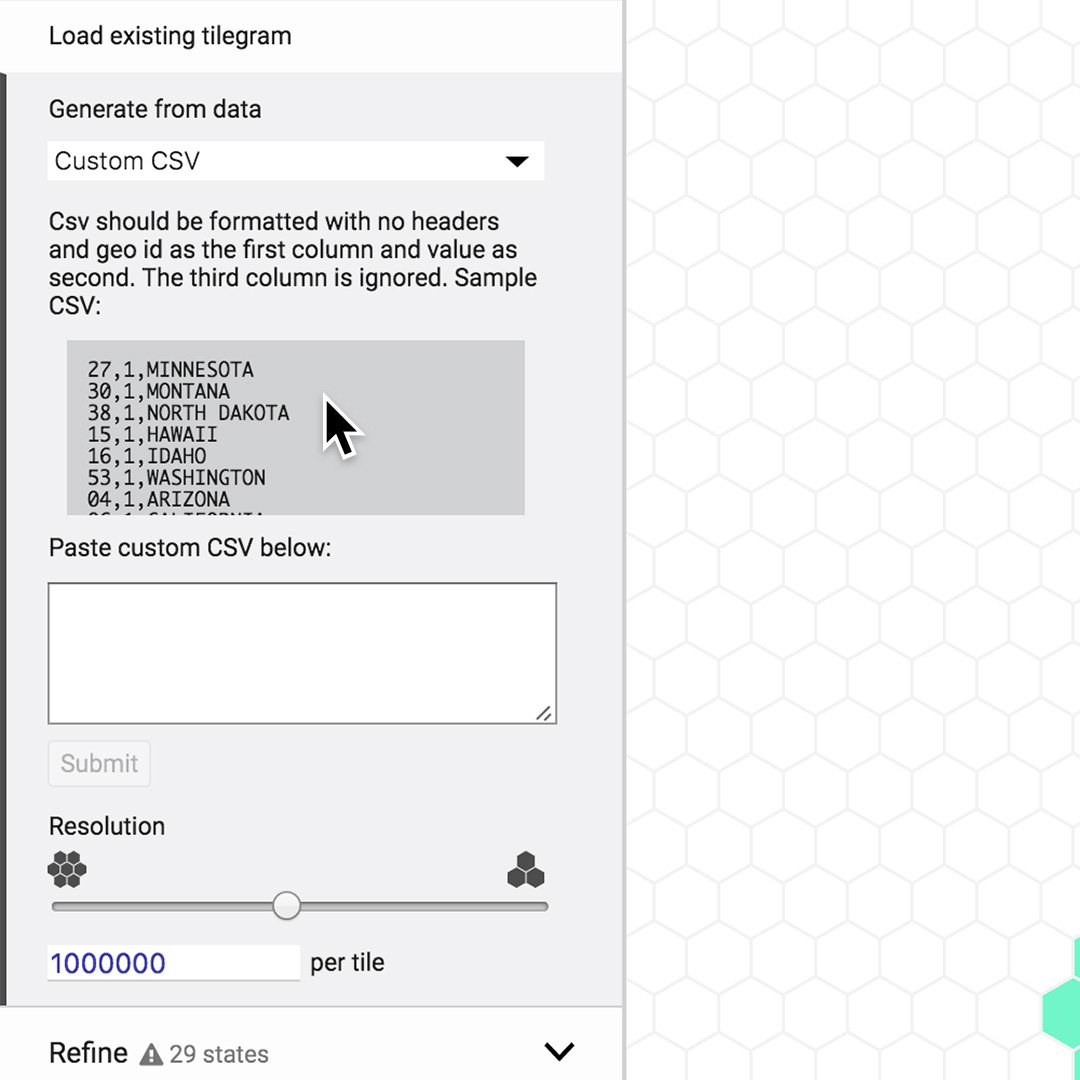
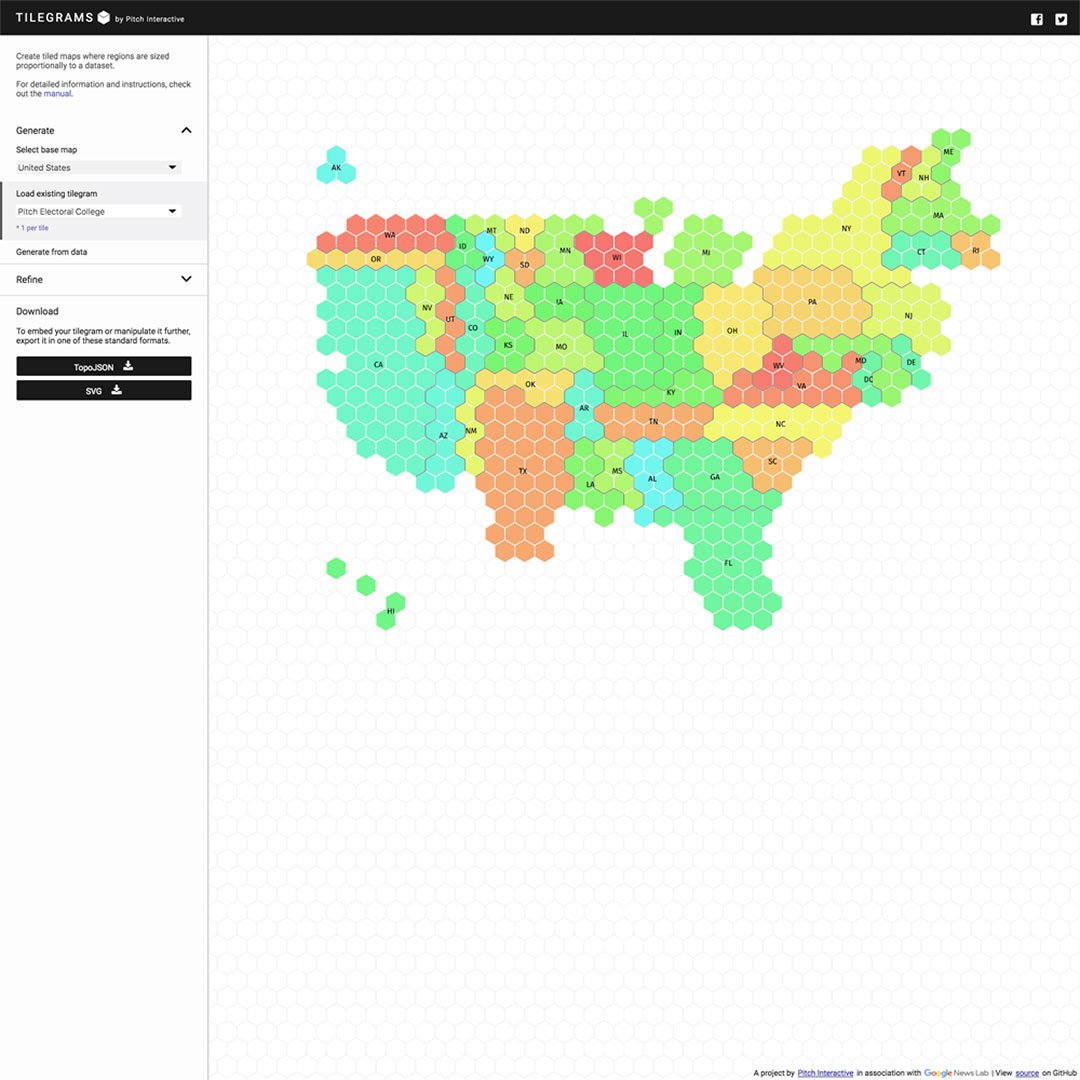
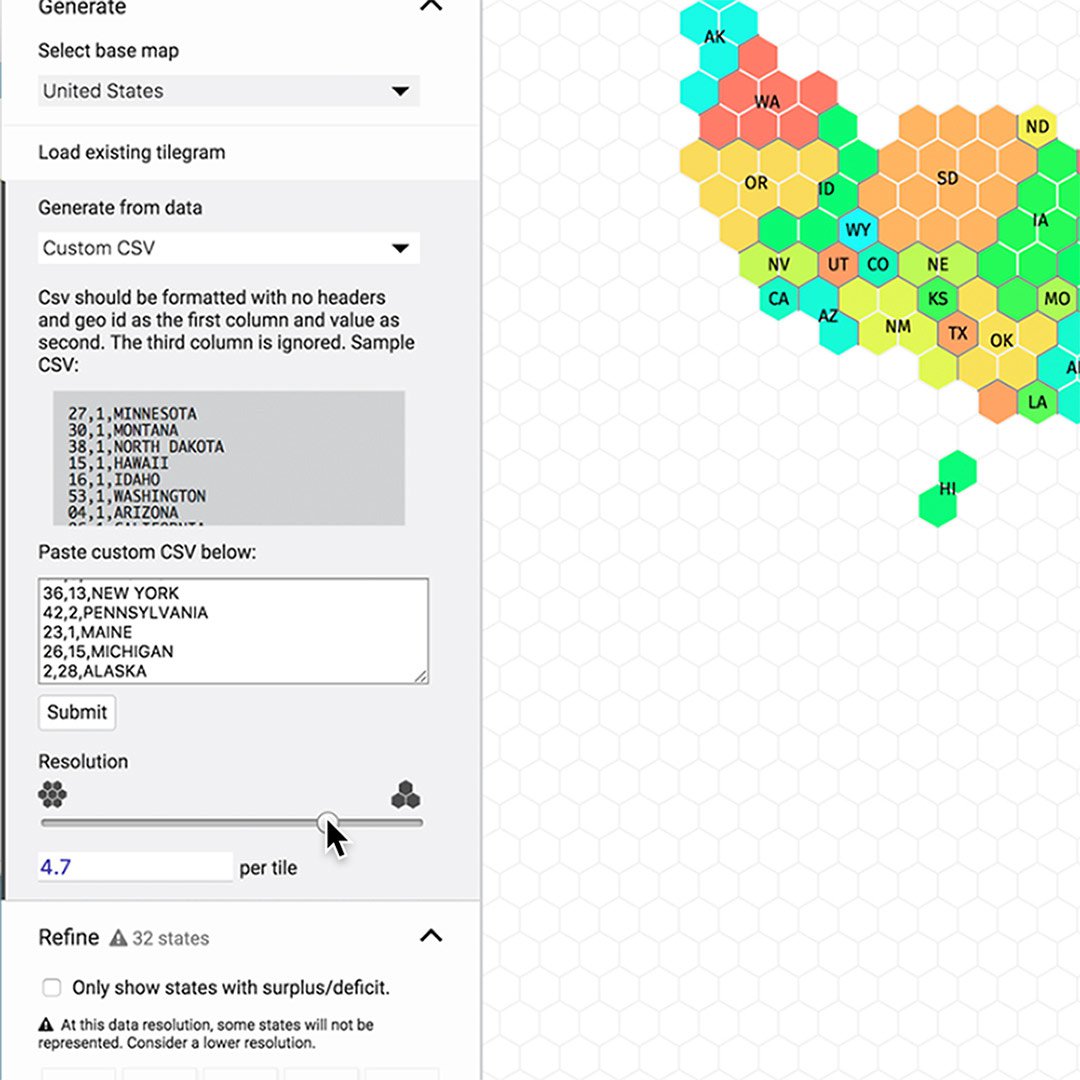
Begin by selecting Generate from data.
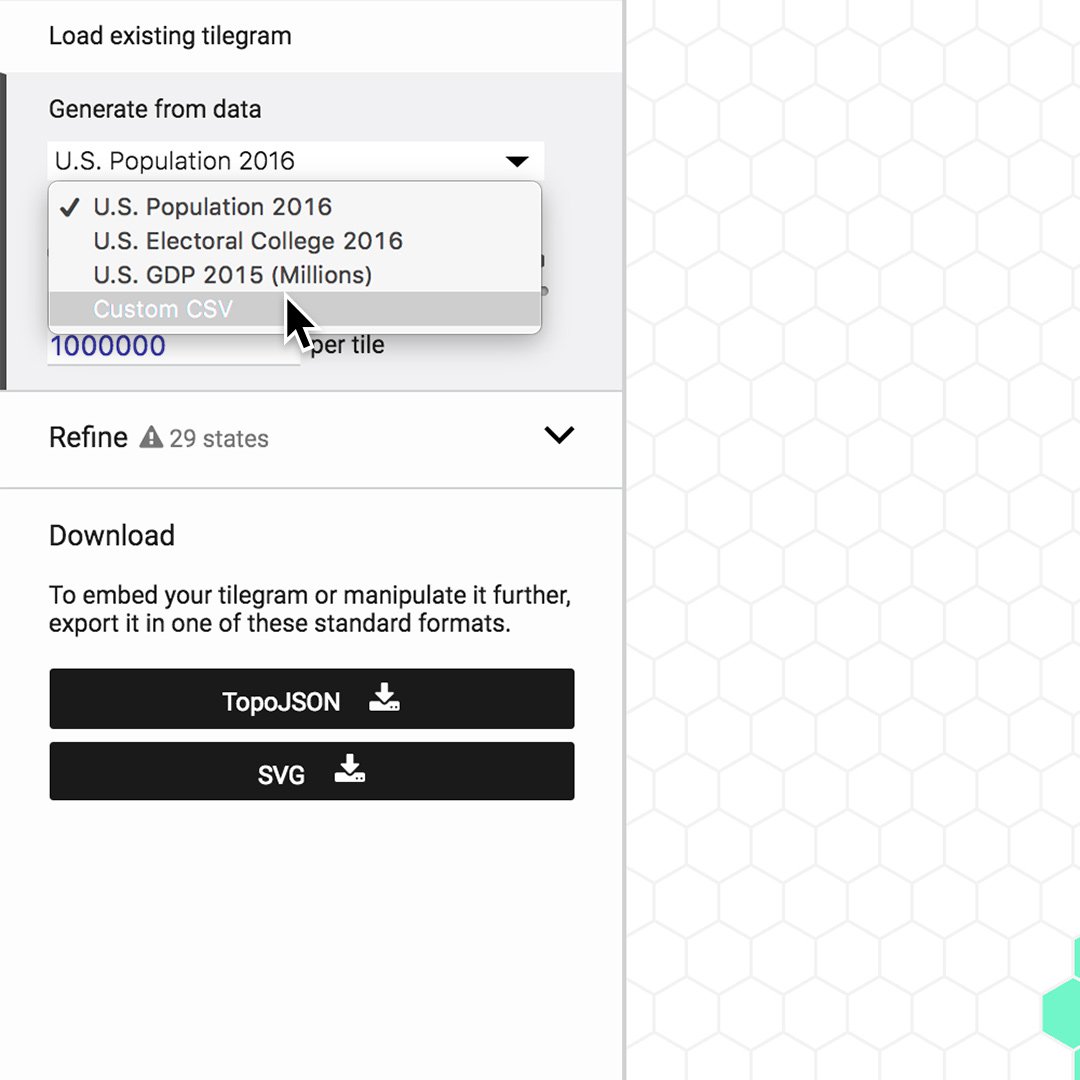
Click on the drop-down menu, and you’ll see that you can choose from a few data-driven U.S. Tilegram base maps.
You can also choose Custom CSV to upload your own dataset.
Finding Geo ID codes for different regions.
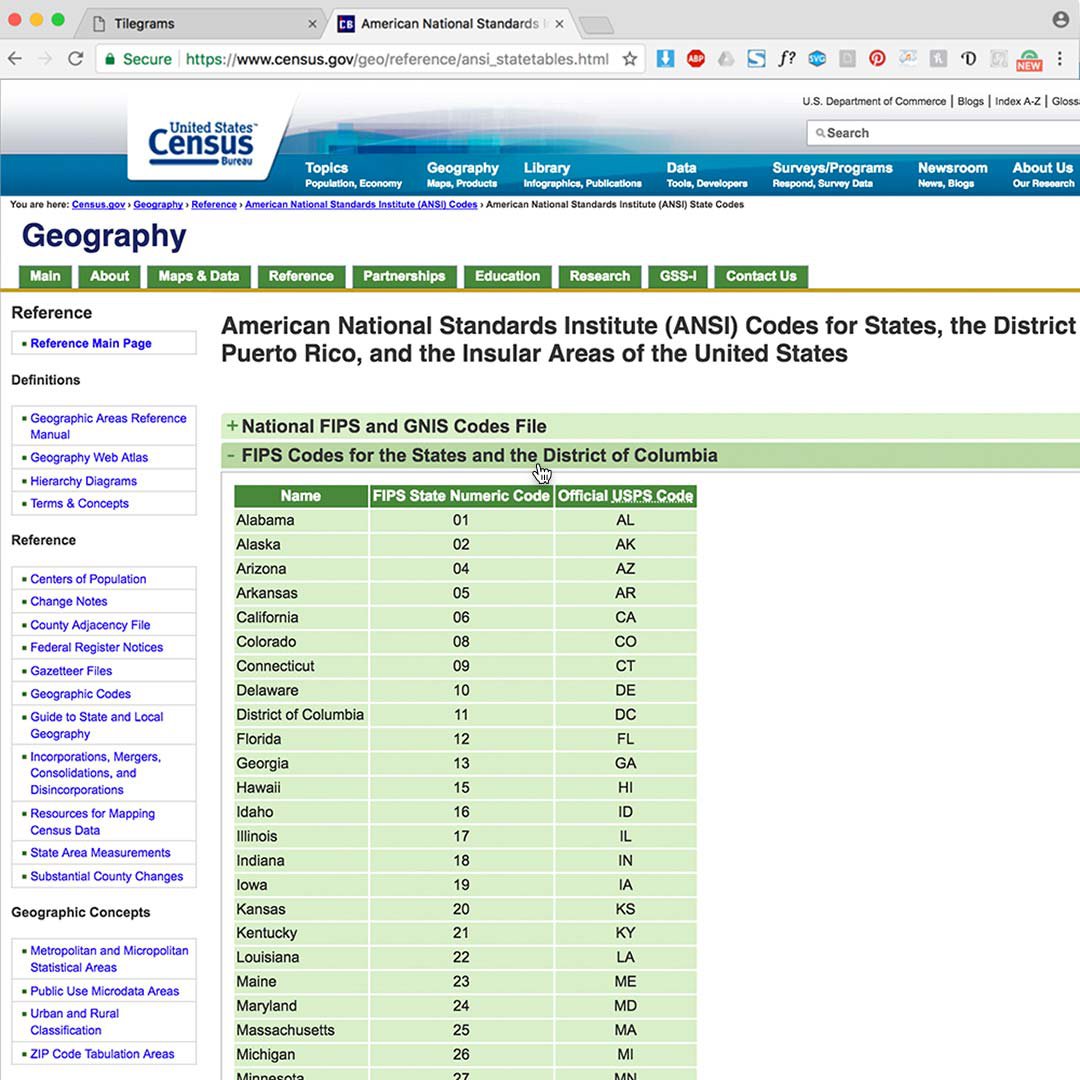
To generate a new Tilegram, you’ll need to know its Geo ID coding; these are the inputs that give your Tilegram the right geographic shape. For example, the U.S. uses FIPS state codes to identify its 50 states and additional territories. France and Germany use ISO-3166-2 codes.
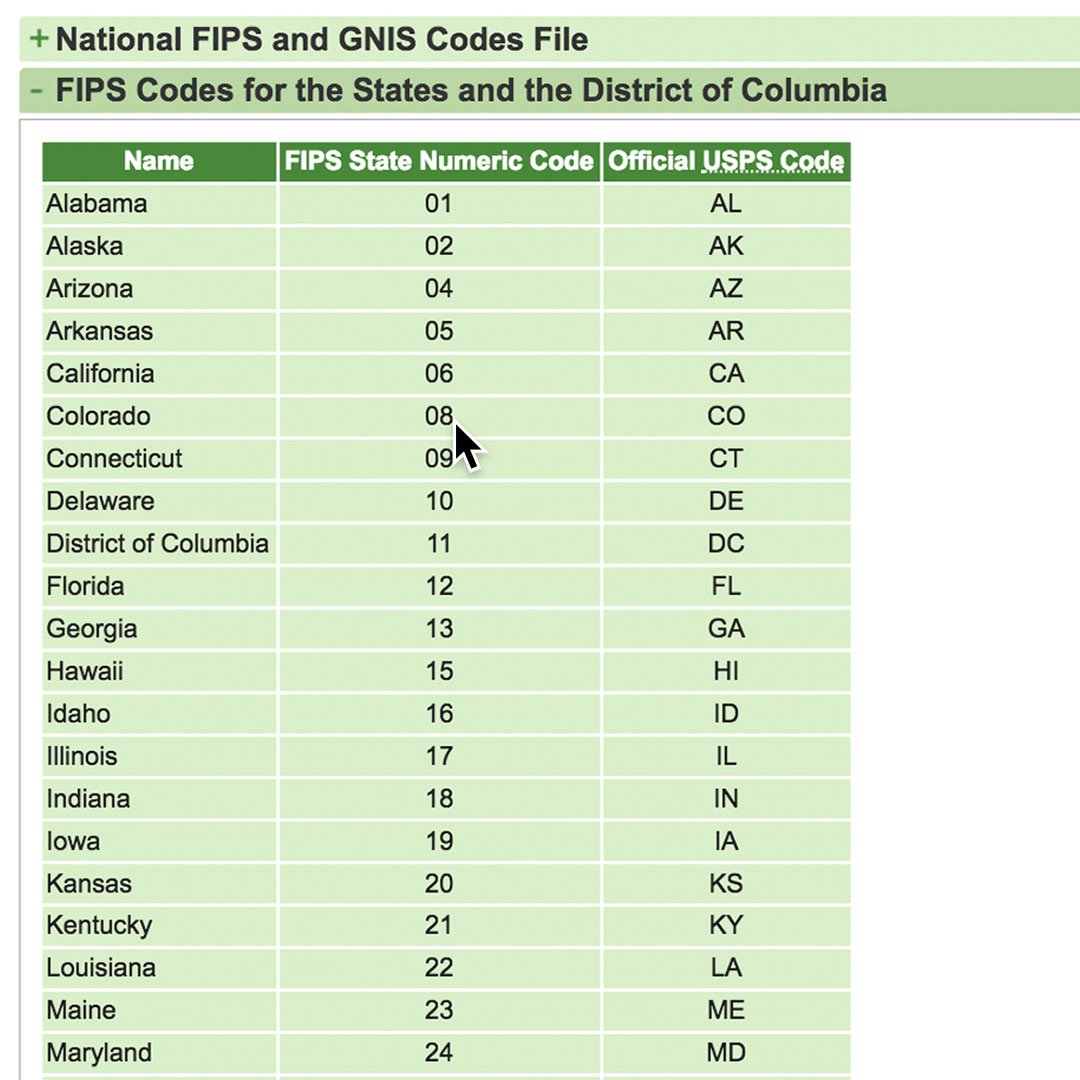
U.S. Geo ID dataset by CensusClick the link above. On the homepage, click FIPS Codes for the States and the District of Columbia.
You’ll find the individual state codes in the center column.
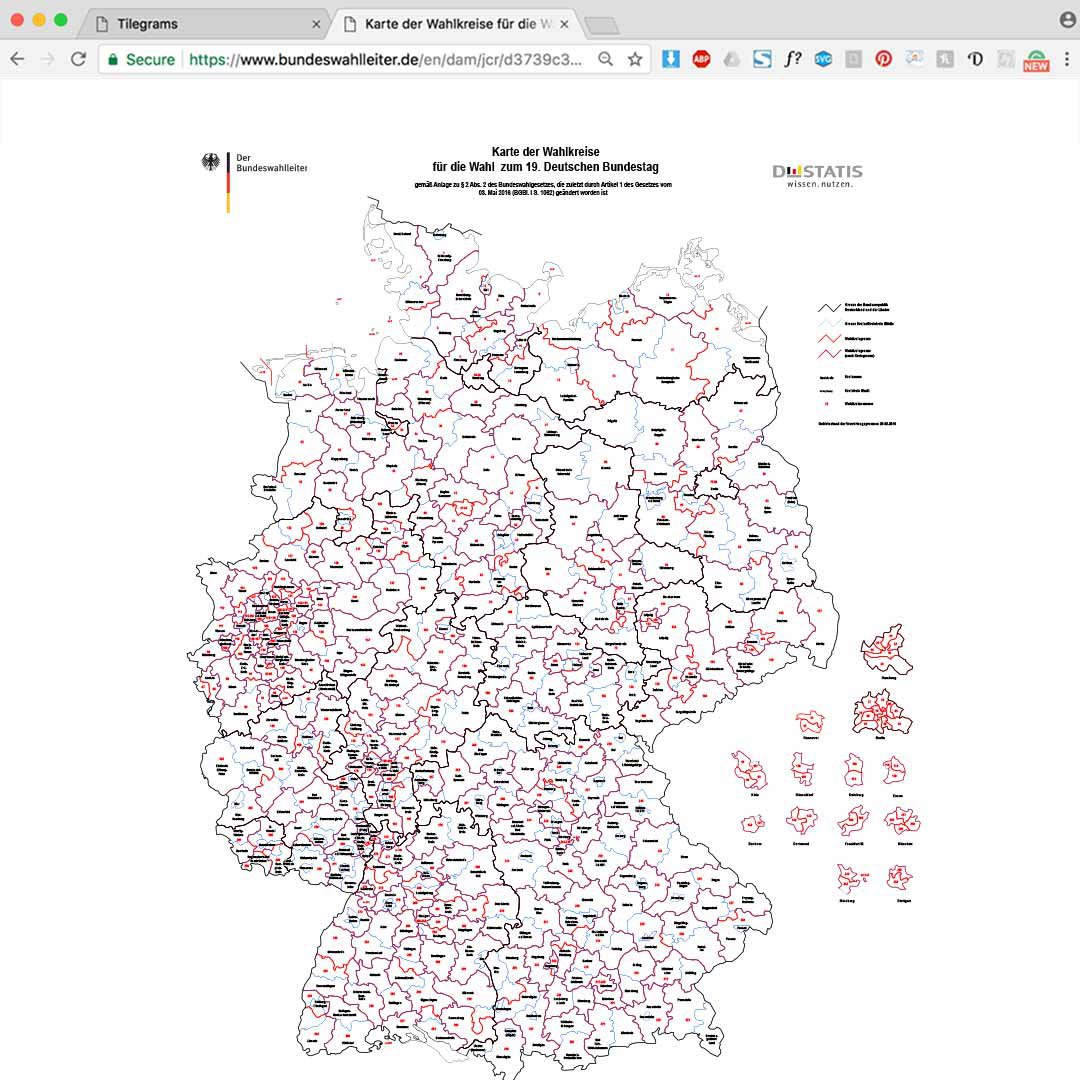
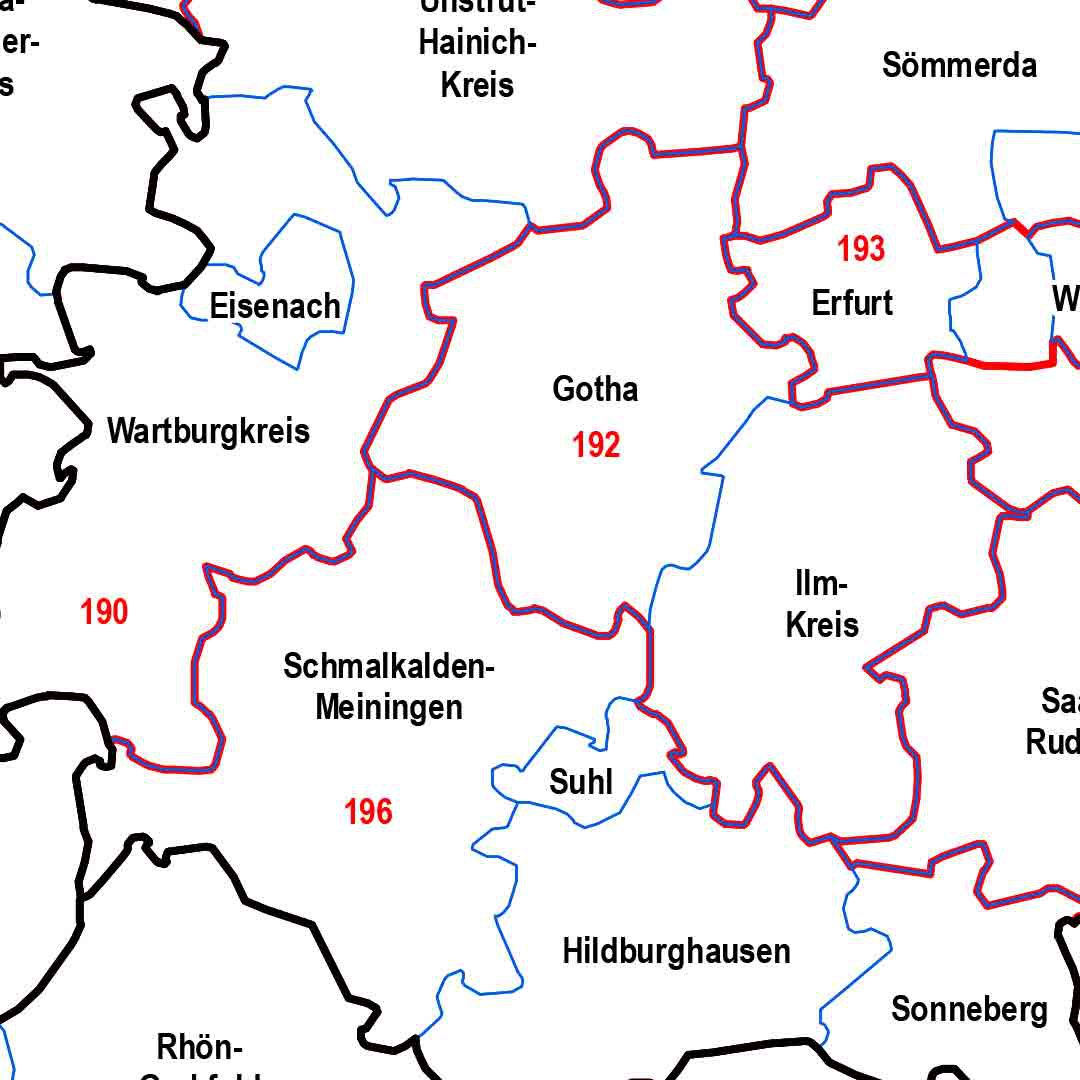
Germany Geo ID dataset by Bundeswahlleiter Click the Germany Geo ID link above and you’ll arrive at a map of German constituencies.
Zoom in on the map to reveal the code for each constituency.
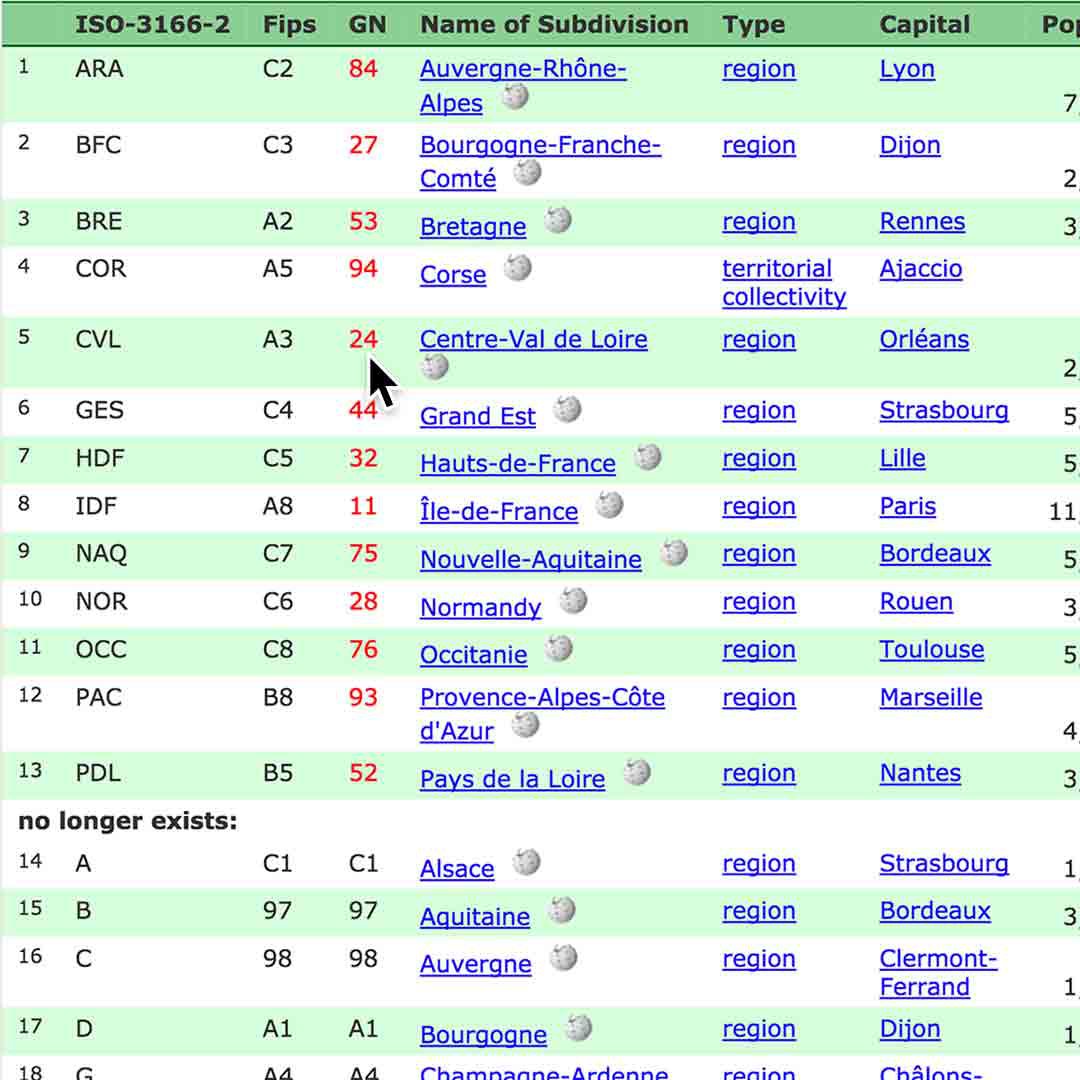
France Geo ID dataset by GeonamesClick the France Geo ID link above and you’ll find the region codes under the column labeled GN.
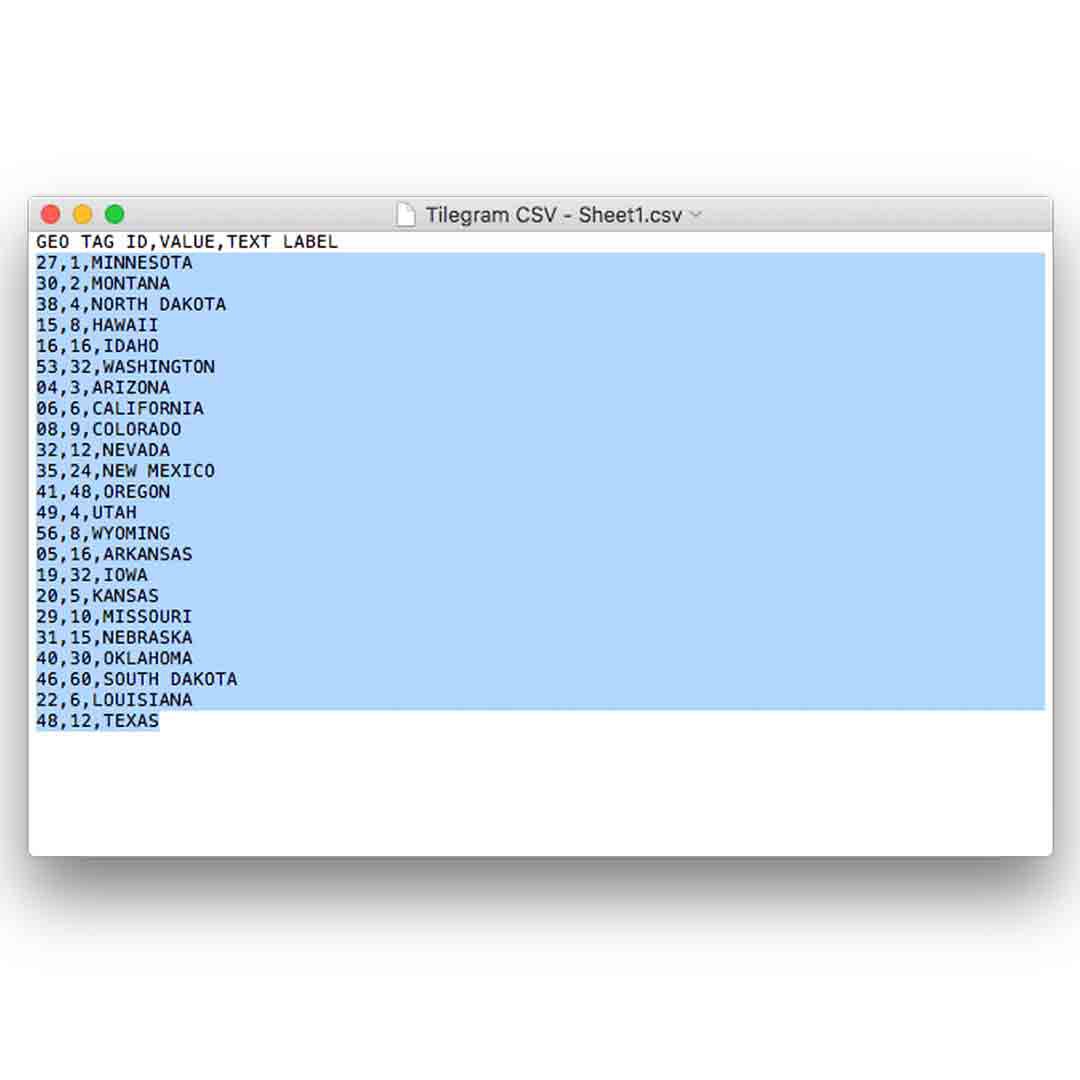
Formatting your Custom CSV.
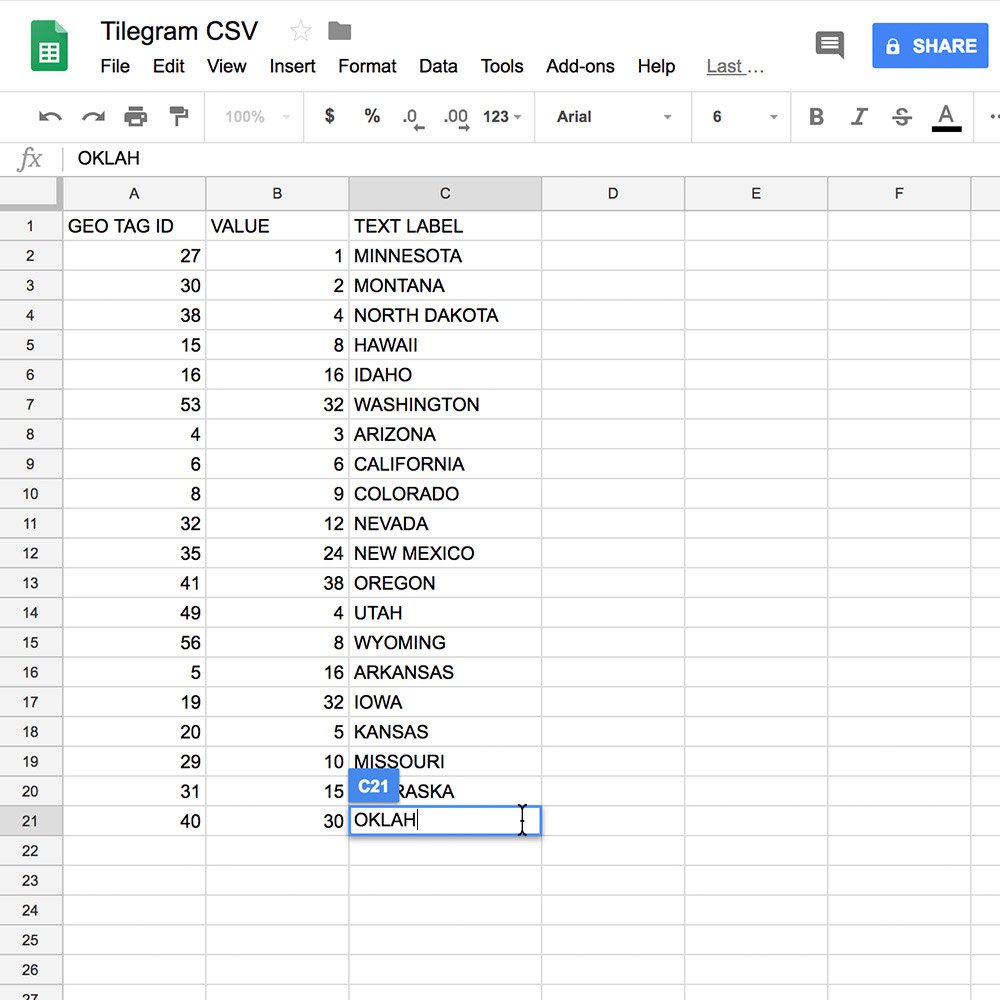
Open a spreadsheet editor. To create your Comma Separated Values (CSV) data source, you will use a three-column model. Column 1: The Geo ID tag for the area. This tells our software “where.” Column 2: The value you want to assign. This tells our software “how many.” For example, population, GDP, etc. Column 3: A text label describing the territory such as “California” or “New York”. This does not affect the shape of the Tilegram in any way.
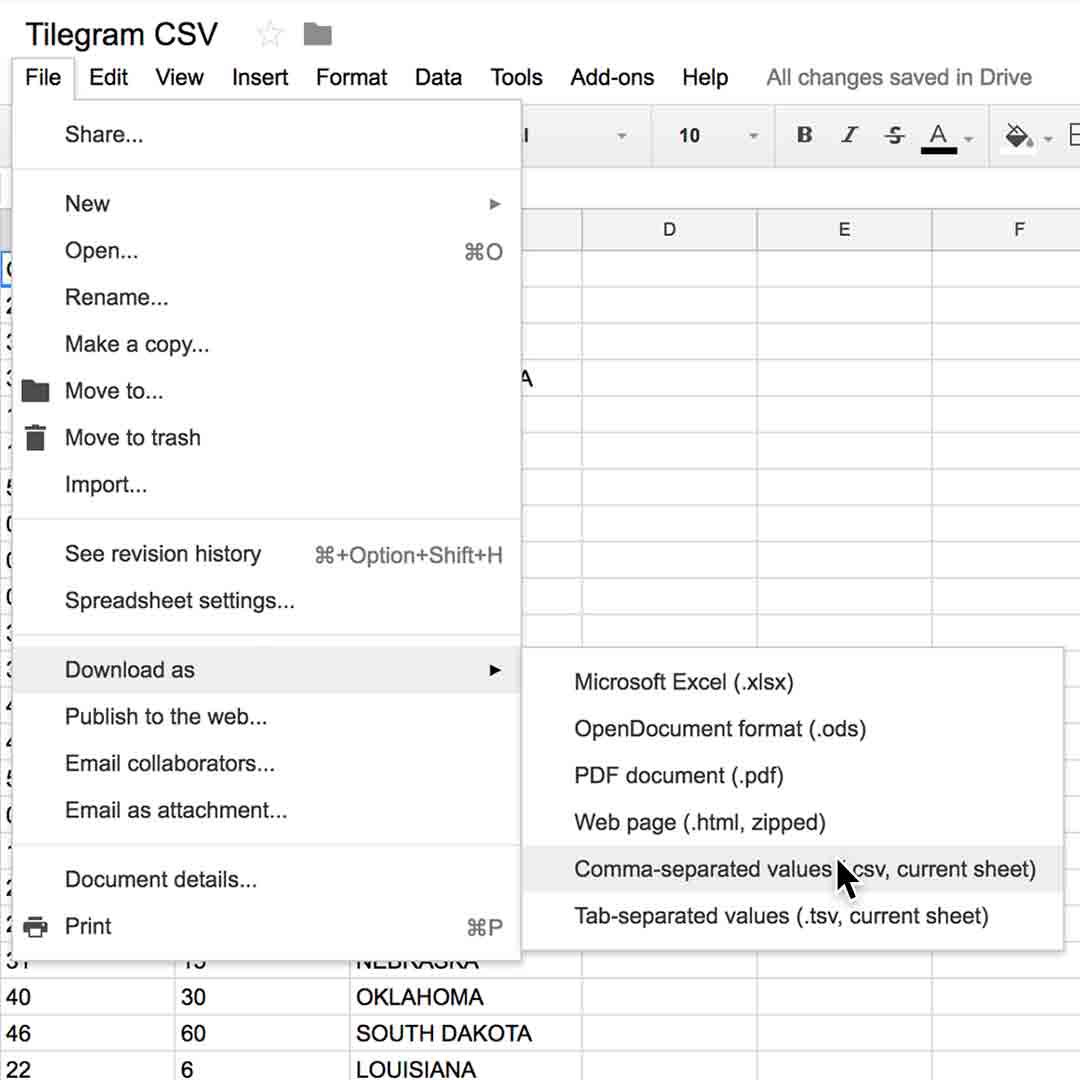
When your data is complete, click File, then Download as, and Comma Separated Values.
Making your Tilegram.
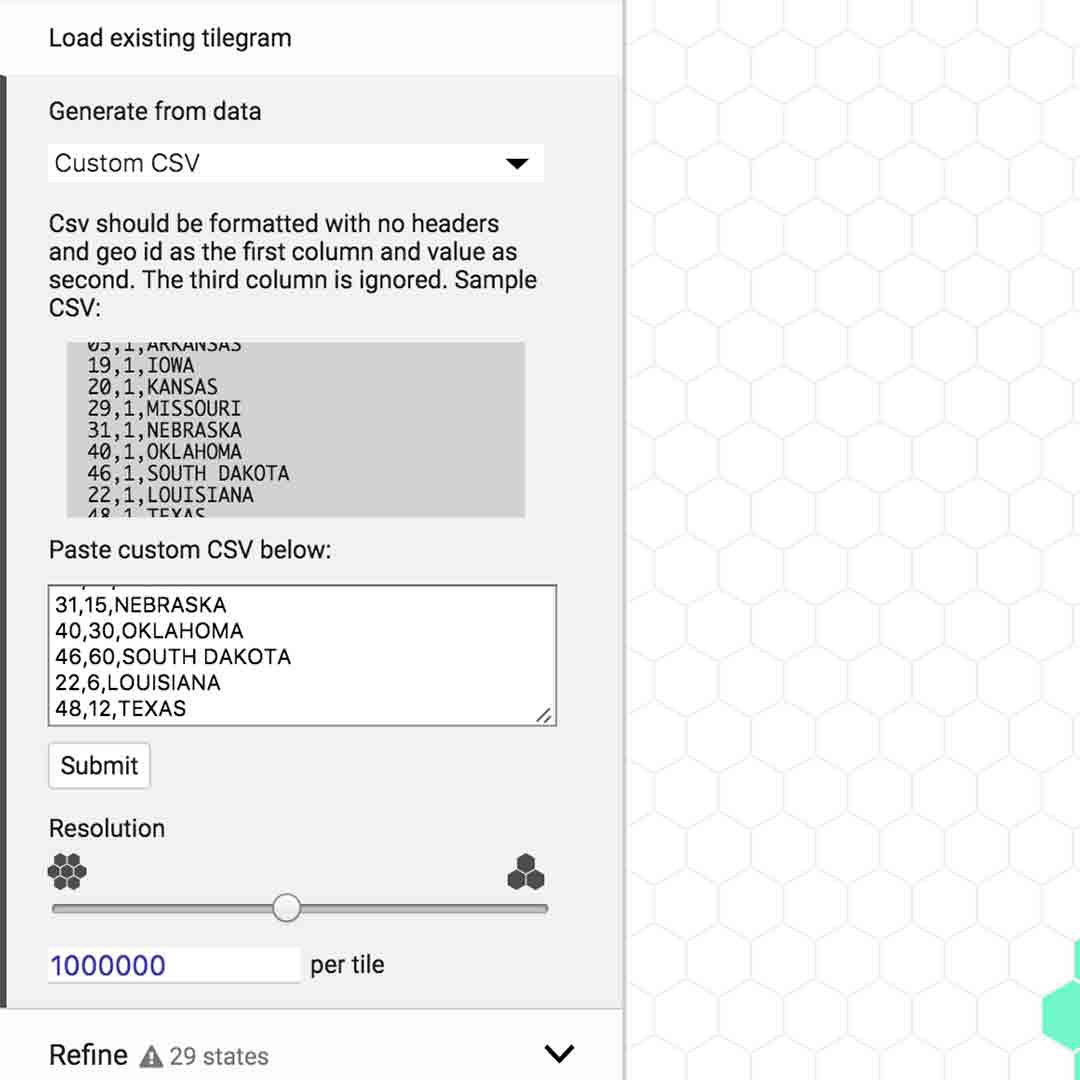
Once your data source is properly formatted and ready, select all and copy.
Paste the values into the window labeled Paste Custom CSV below.
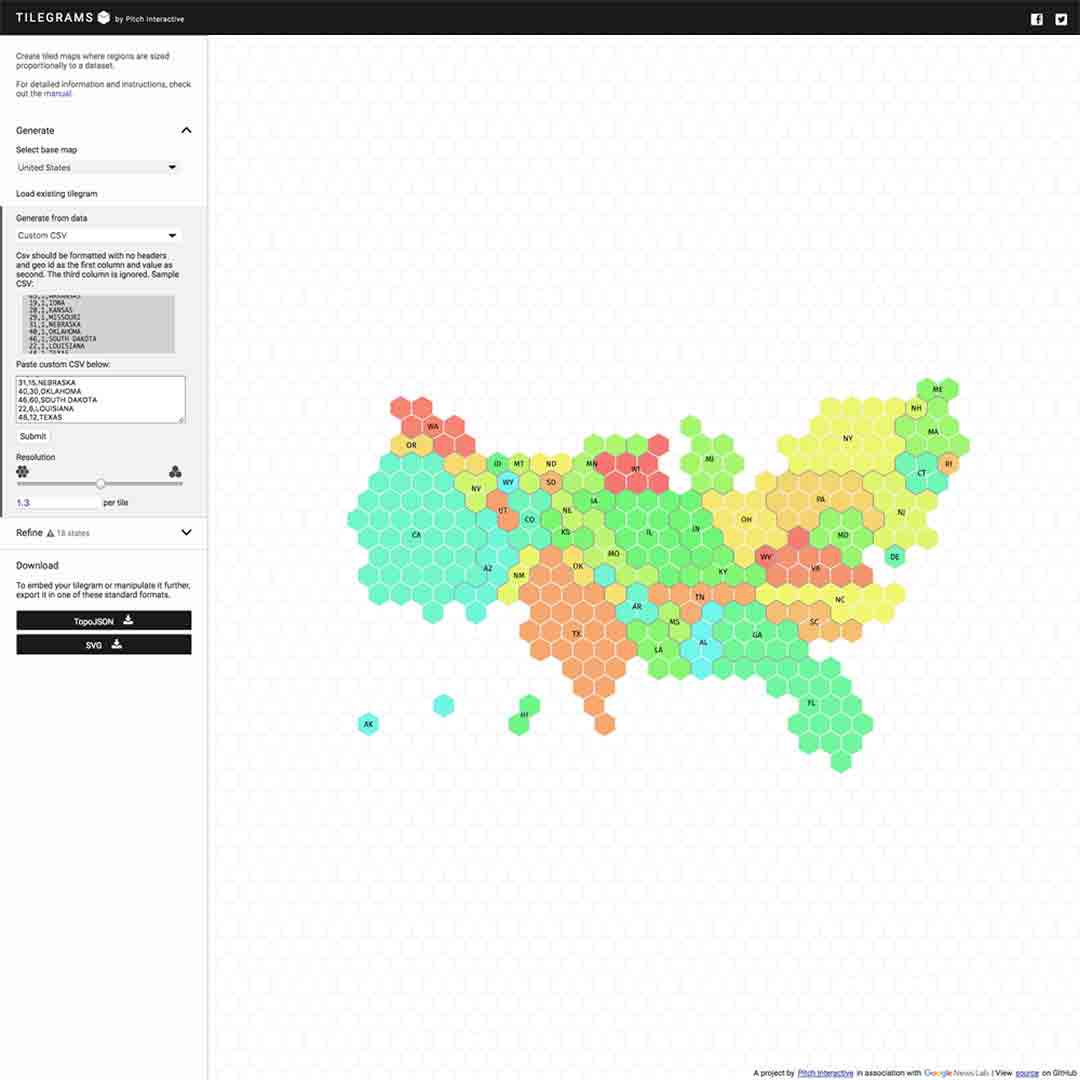
Your Tilegram should begin automatically generating in the window to the right.
Adjusting and downloading.
Now, you can follow the same steps you would use for an existing Tilegram.
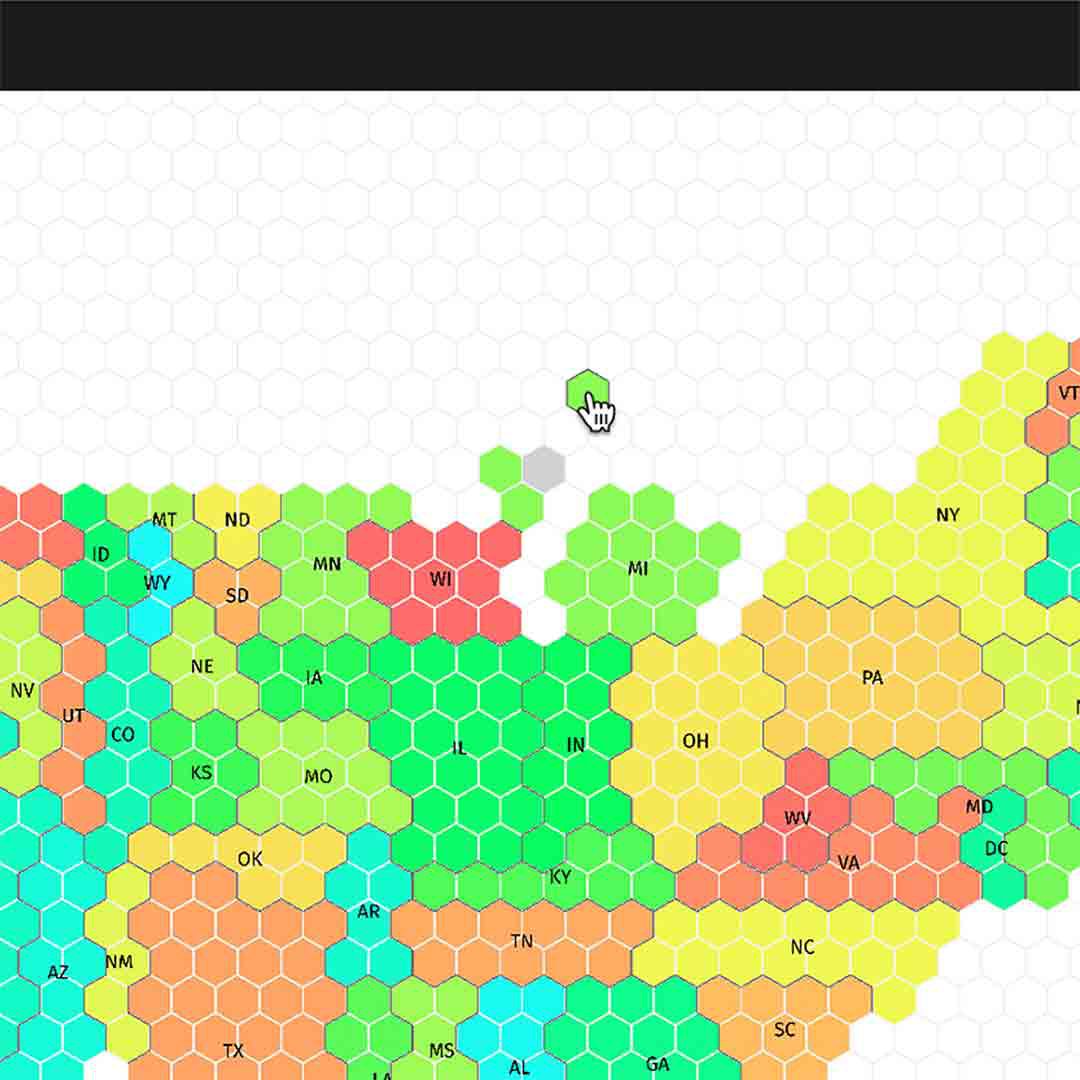
Drag tiles around.
Adjust the resolution to find the right balance to keep your creation statistically accurate and geographically recognizable. For a detailed look at how Tilegrams was created, read Pitch Interactive’s blog post.
-
![gni_business_lesson_play_26]()
Understand Direct and Programmatic Ad Revenue
LessonSell ads, set prices, pitch advertisers and communicate results -
![image13_2.png]()
Training your Machine Learning model
LessonImport your data in AutoML Vision and start the training process -
![YouTube Thumbnails (20)]()
Video: Google Earth and mapping technologies for journalists
LessonDiscover how journalists can use Google Earth and mapping technologies