Google Data GIF Maker
Visualize data comparisons in minutes.
A simple tool for showing data comparisons.
Data visualizations are an essential storytelling tool in journalism, and though they are often intricate, they don’t have to be complex. In fact, with the growth of mobile devices as a primary method of consuming news, data visualizations can be simple images formatted for the device they appear on.
The Google Data Gif Maker helps journalists make visuals that show share of interest for two competing topics. It is designed for desktop use on Chrome and may not function properly on mobile devices or other browsers. To begin, go to datagifmaker.withgoogle.com, where you can make up to five different GIFs at a time.
Choose two data points.
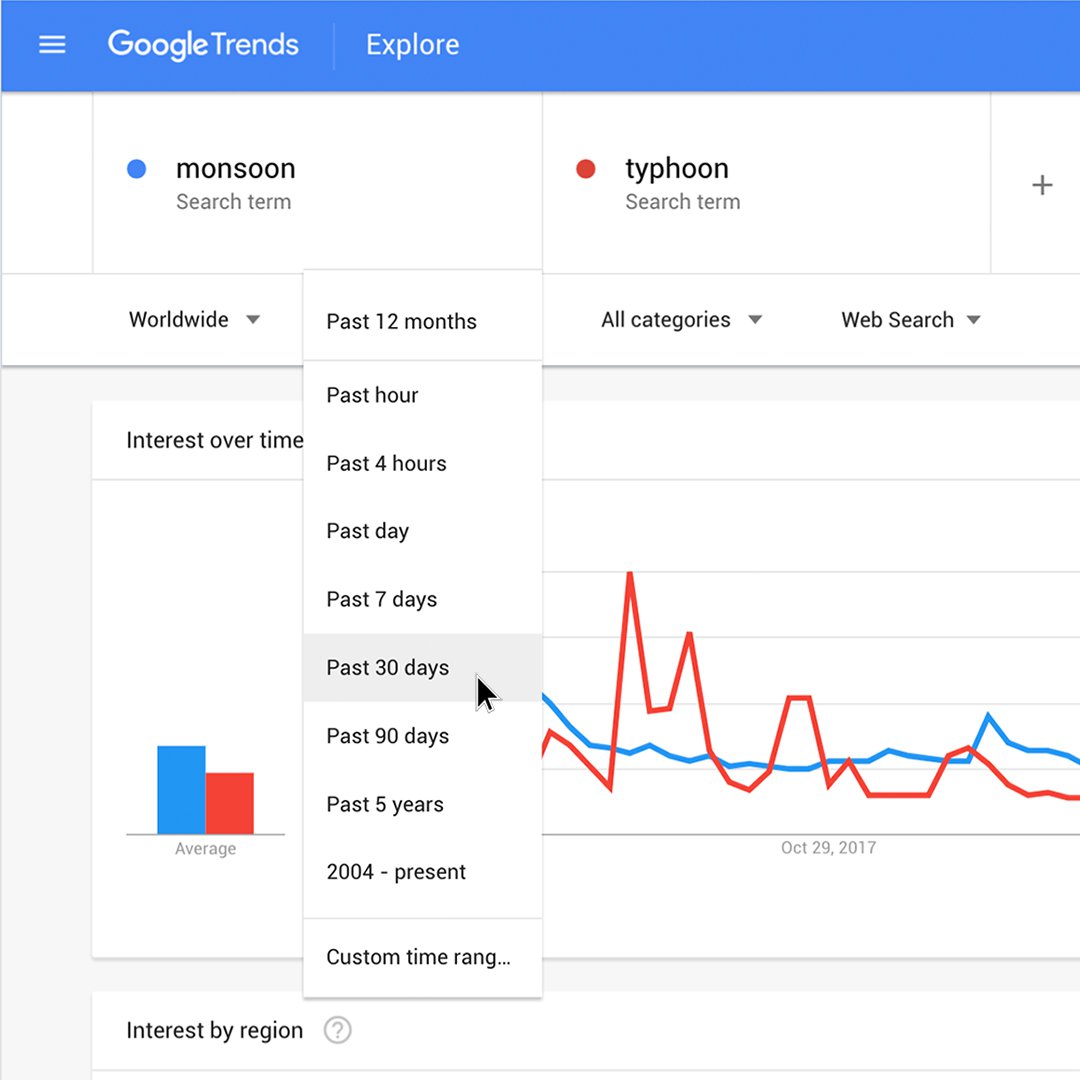

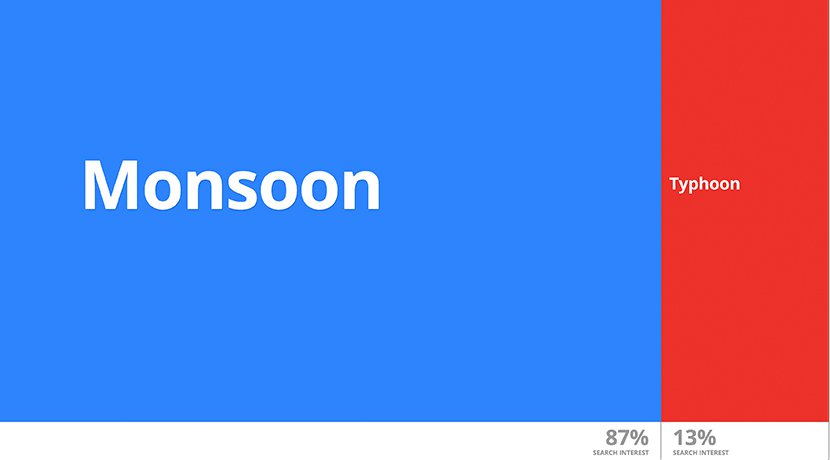
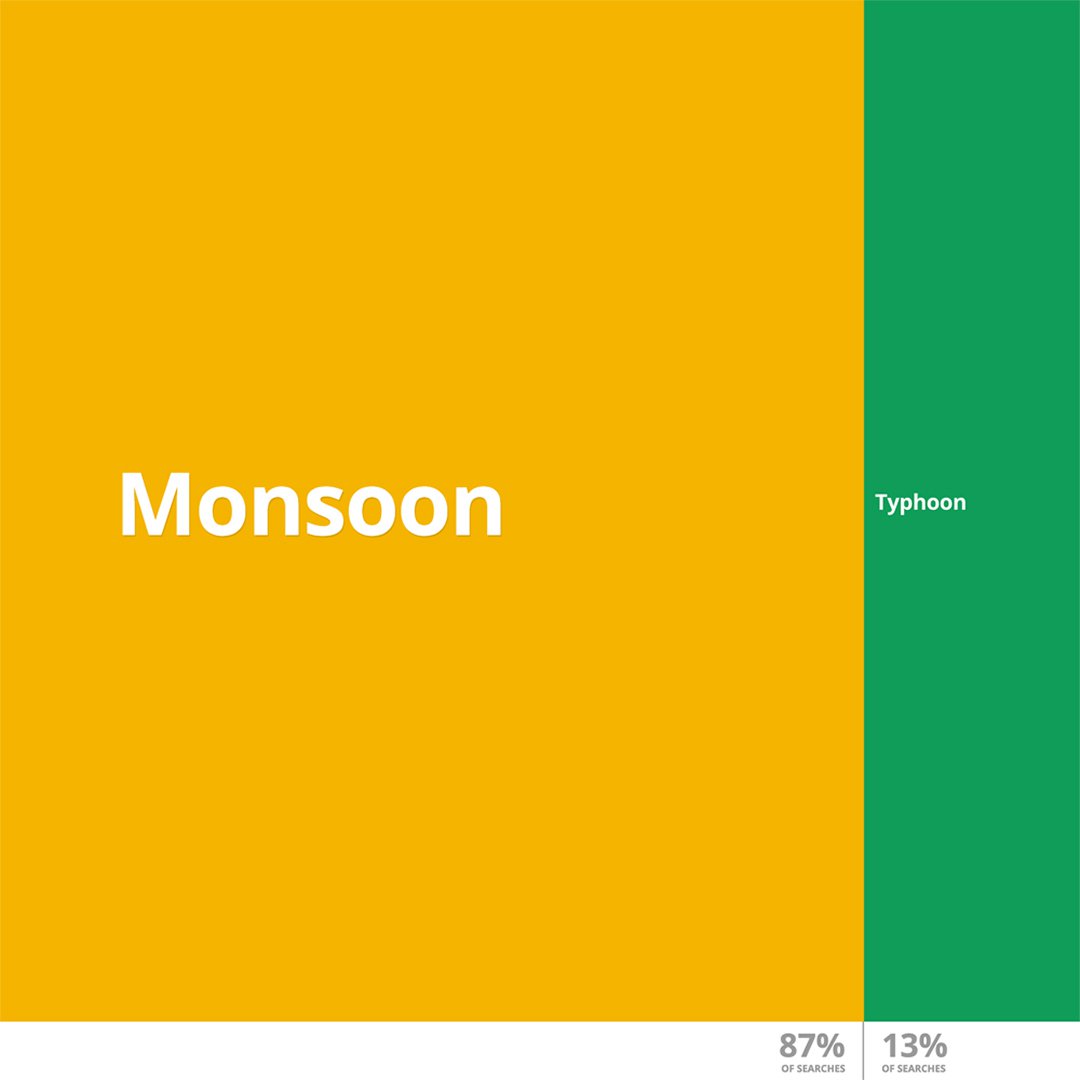
Data GIF Maker is ideal for comparing the relative search interest for two competing terms using the Google Trends “Explore” function.
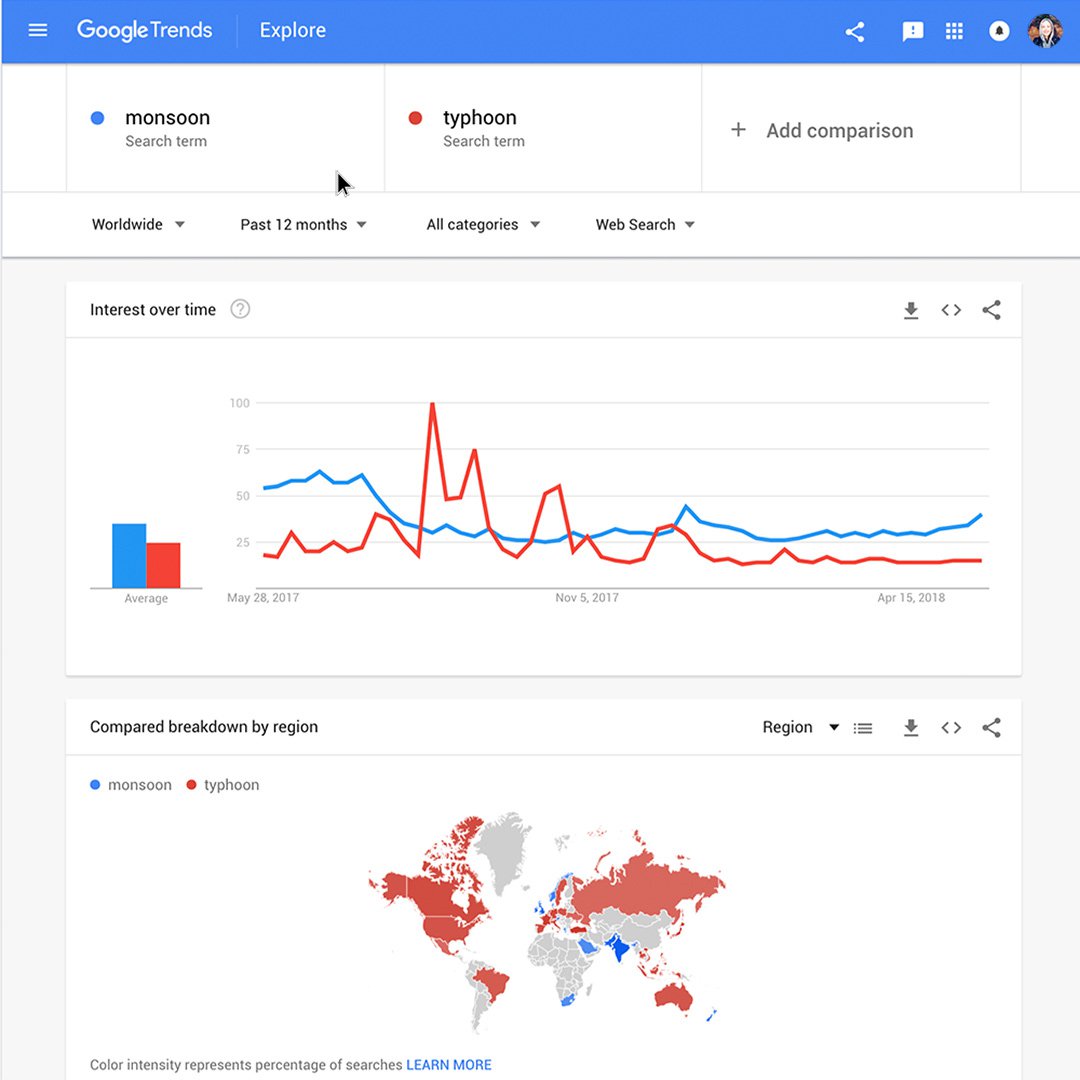
In Google Trends, enter two competing terms, such as Monsoon and Typhoon.
Specify the time range and region you want to compare, such as Last 30 Days and India.
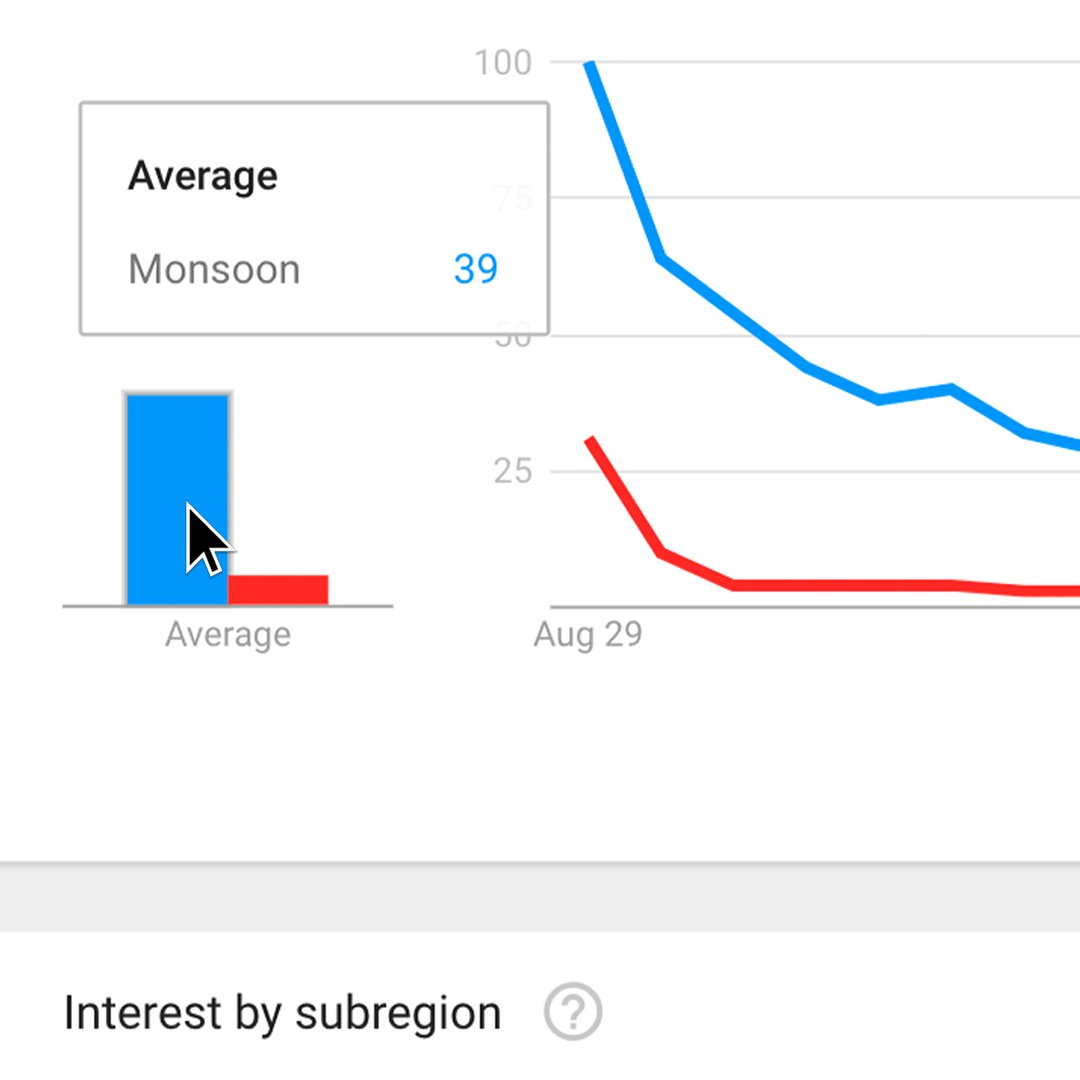
You’ll see the average relative search interest based on your inputs.
You can also use Data GIF Maker to compare any two data points of your choosing such as polling numbers, sales figures, movie ratings, etc. simply by entering the two numbers.
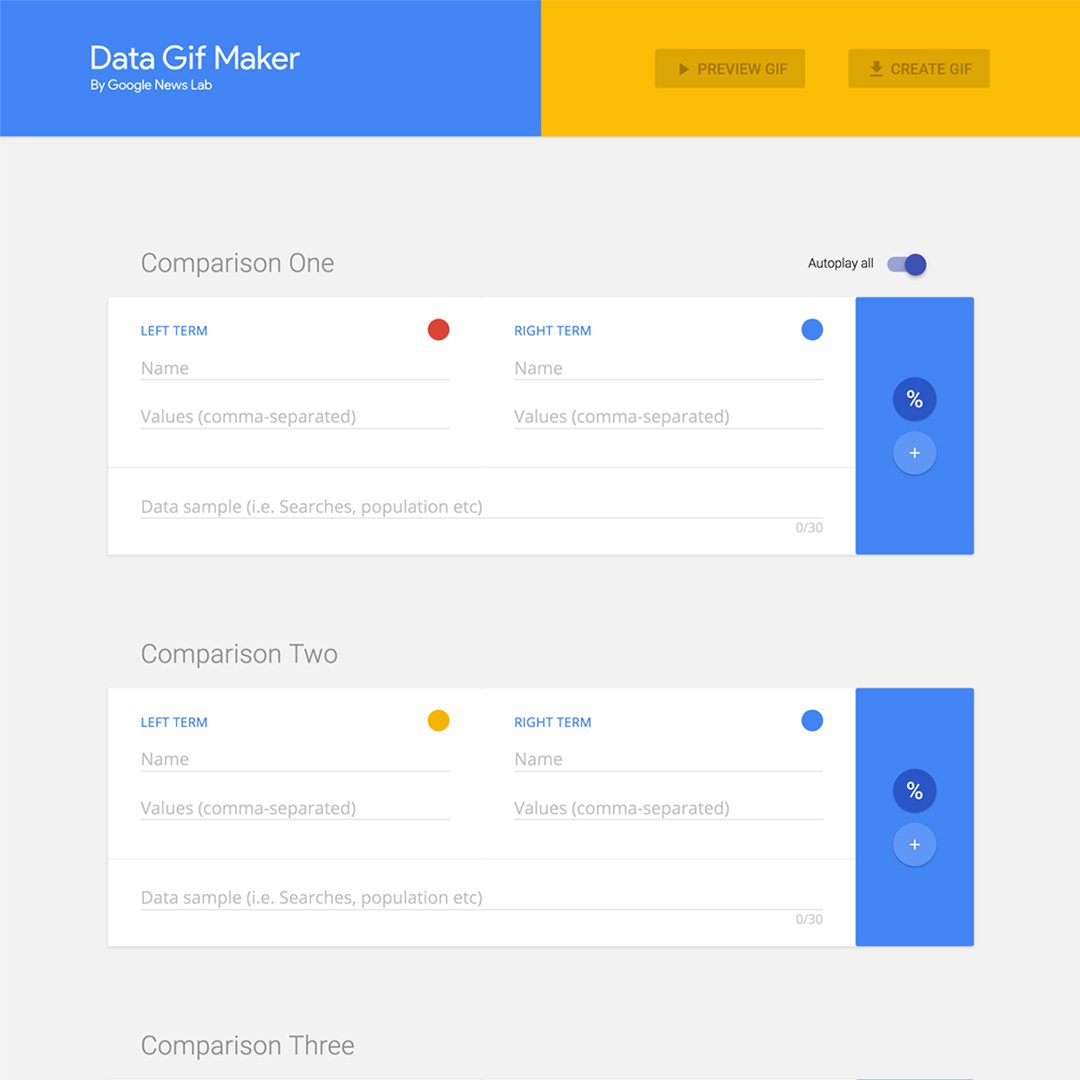
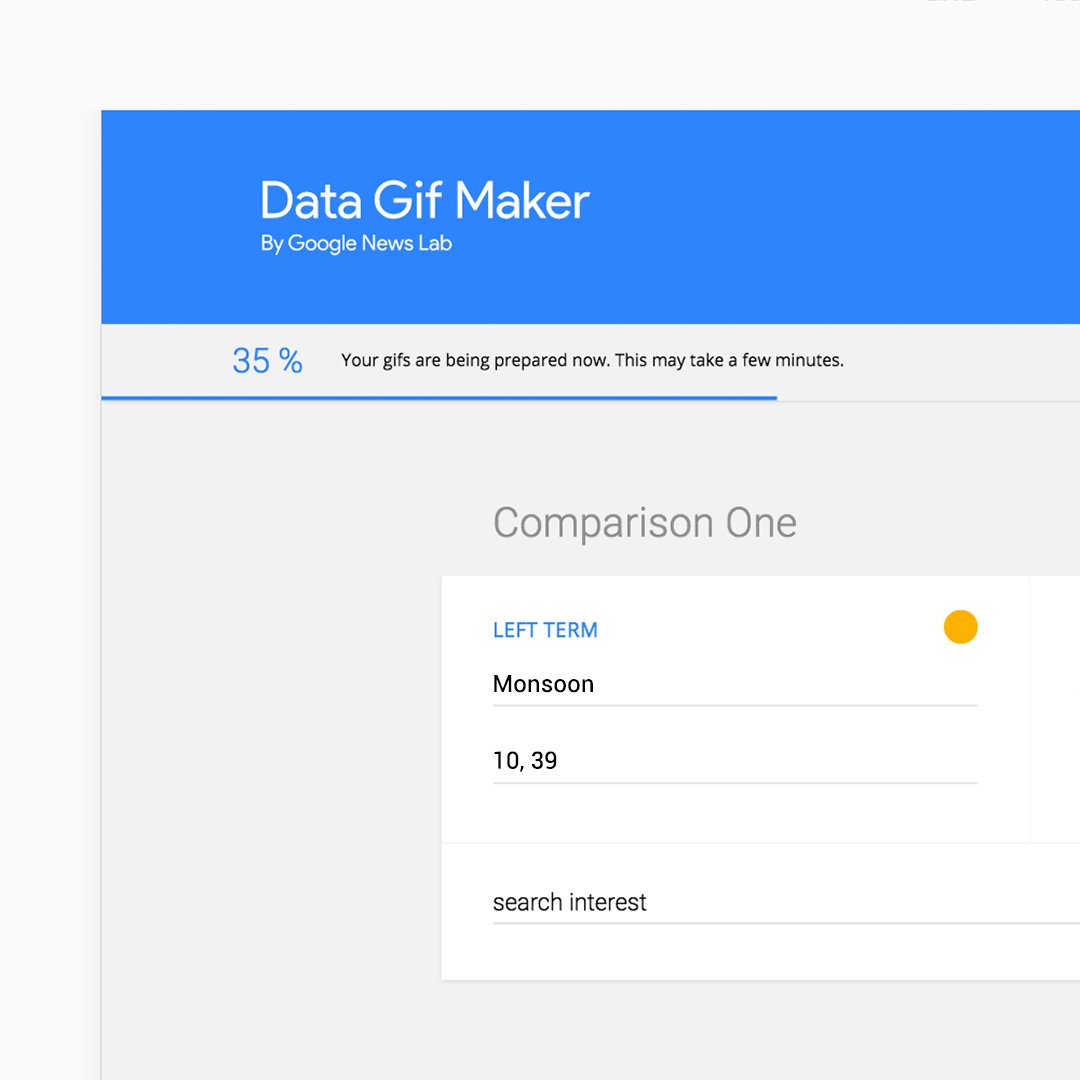
Customise your design.
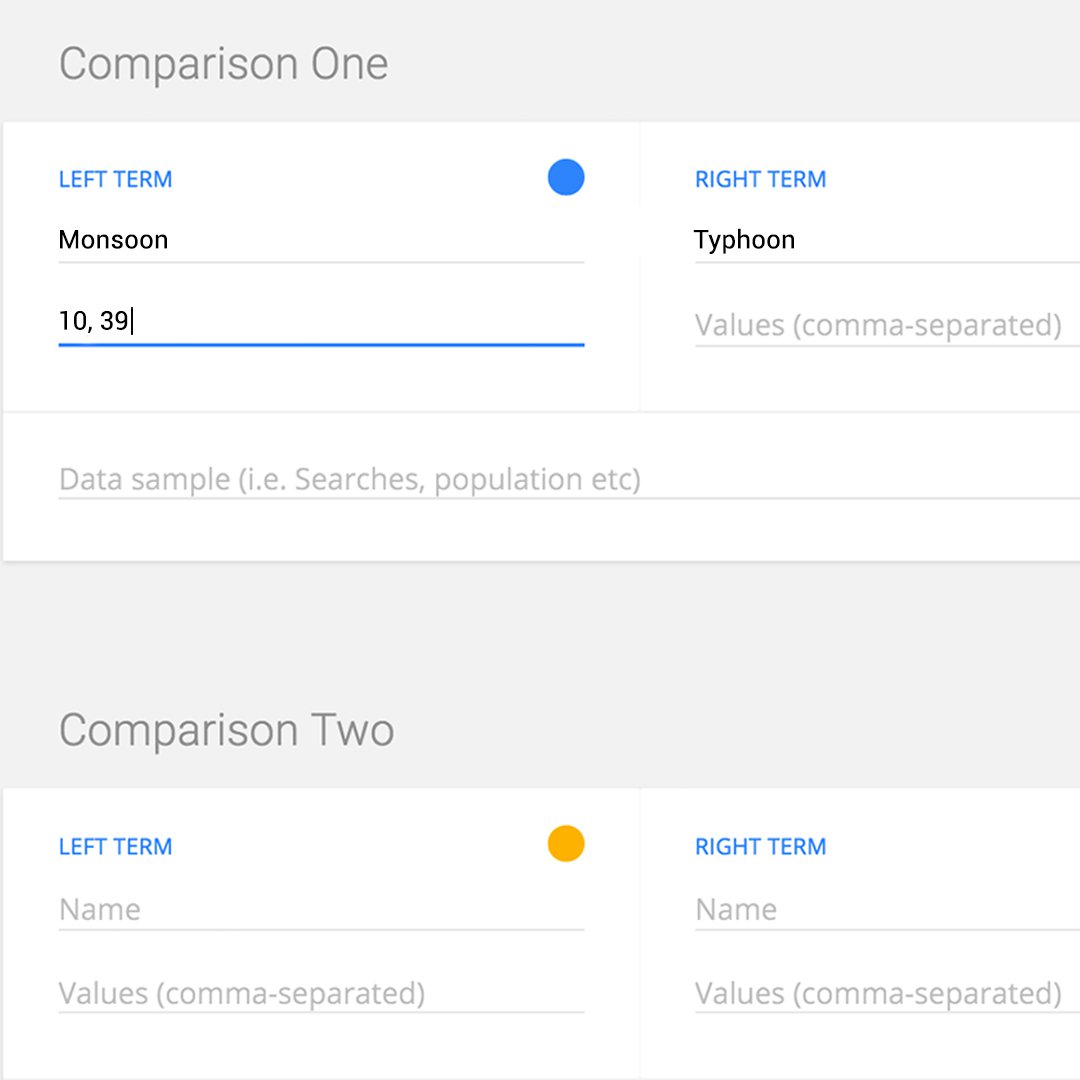
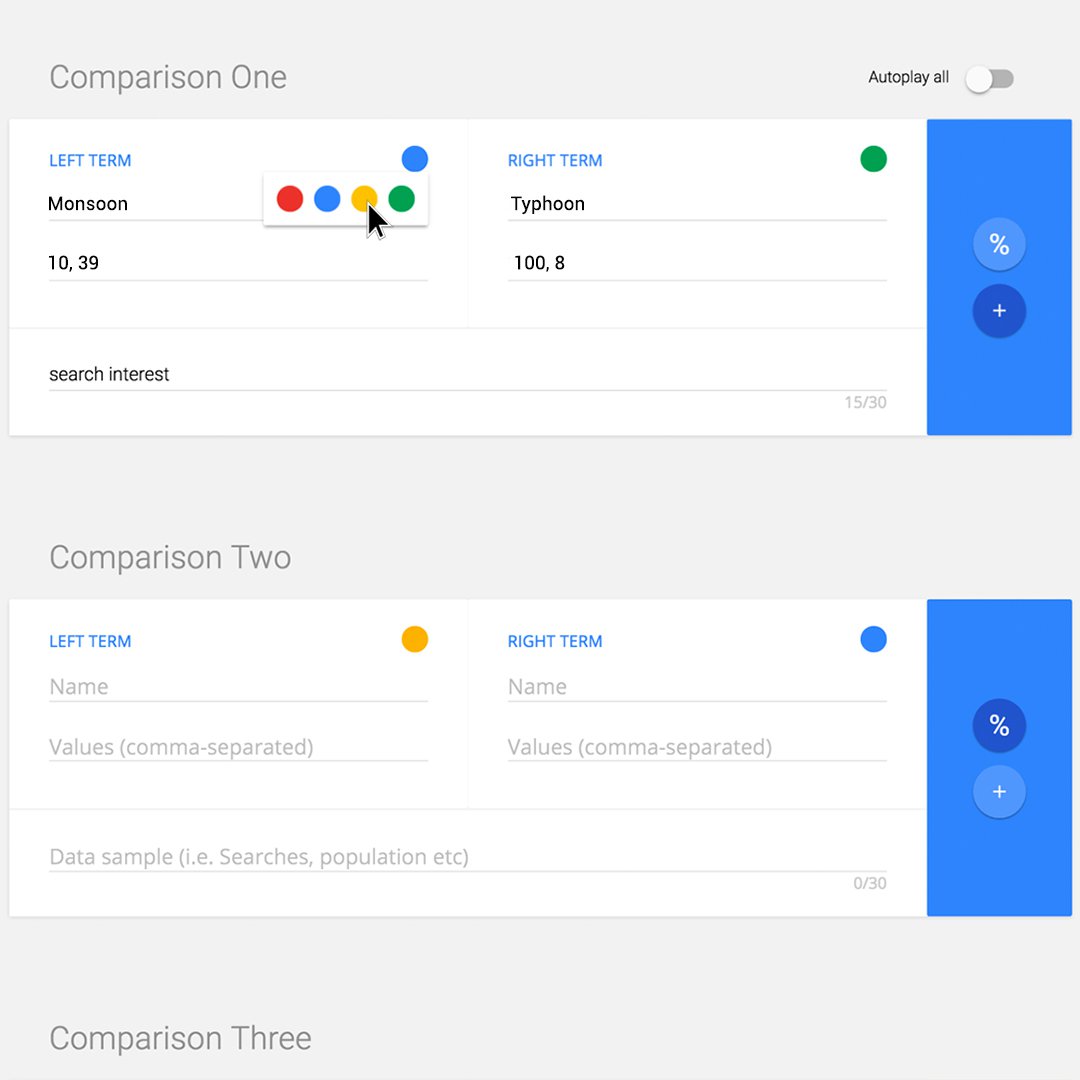
Now that you’ve chosen your data points, go to datagifmaker.withgoogle.com to begin creating your GIF.
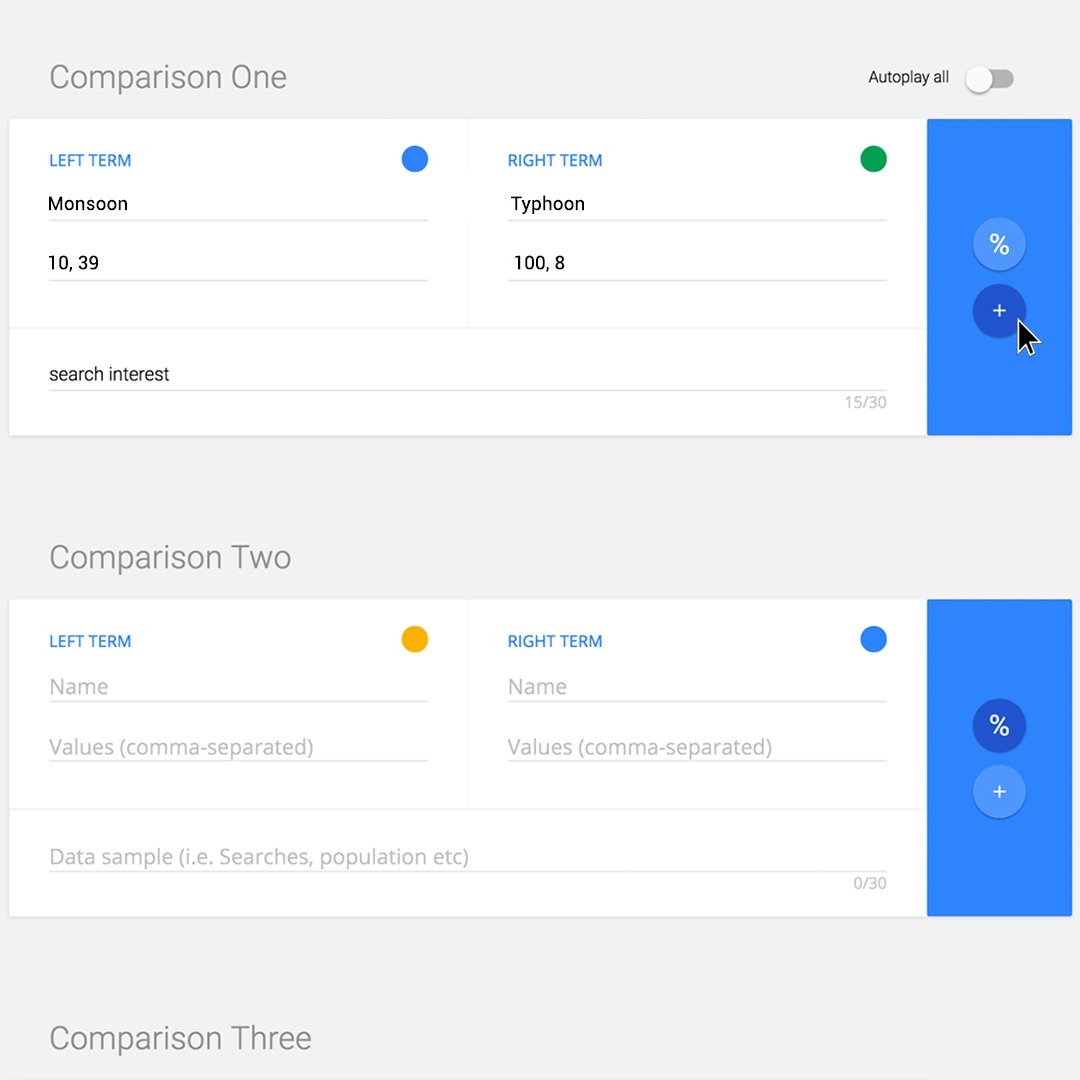
Add the name of each of your two data points, the numbers representing your data, and explanatory text at the bottom such as “search interest.” Do not use commas within numbers: for example, 1,000,000 would be entered as 1000000. However, you can use comma-separated values to create a toggle effect in the animation.
Choose whether you want to show terms as numbers or percentages by clicking either + or %. For percentages, just enter your values and the app automatically calculates the % ratio for you.
Next, select colours by clicking on the colored dots.
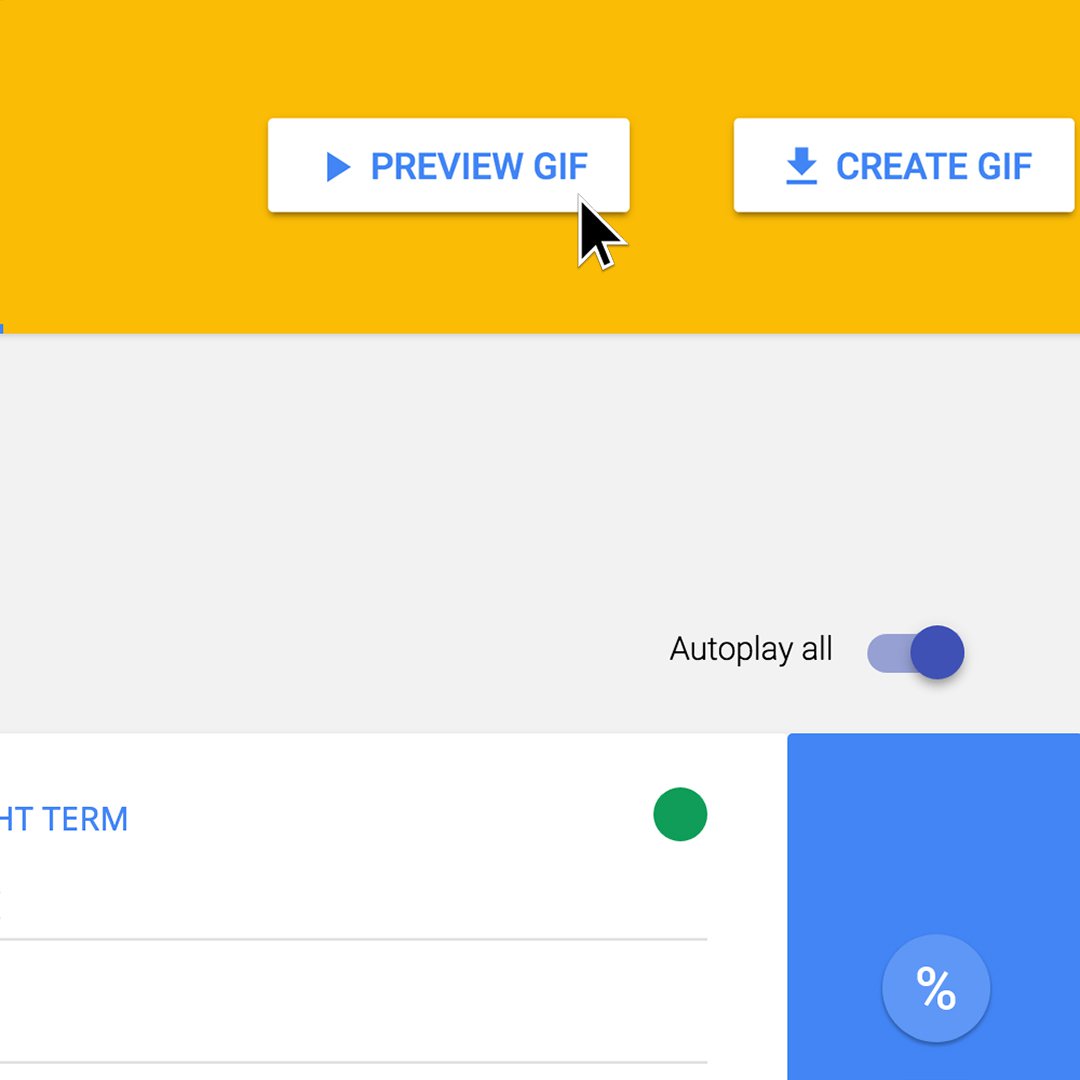
To create your GIF, select “Preview GIF.”
Steps
To preview single or multiple GIFs, click Preview GIF.
The tool will automatically open a new browser window and show you up to five GIFs you’ve created.
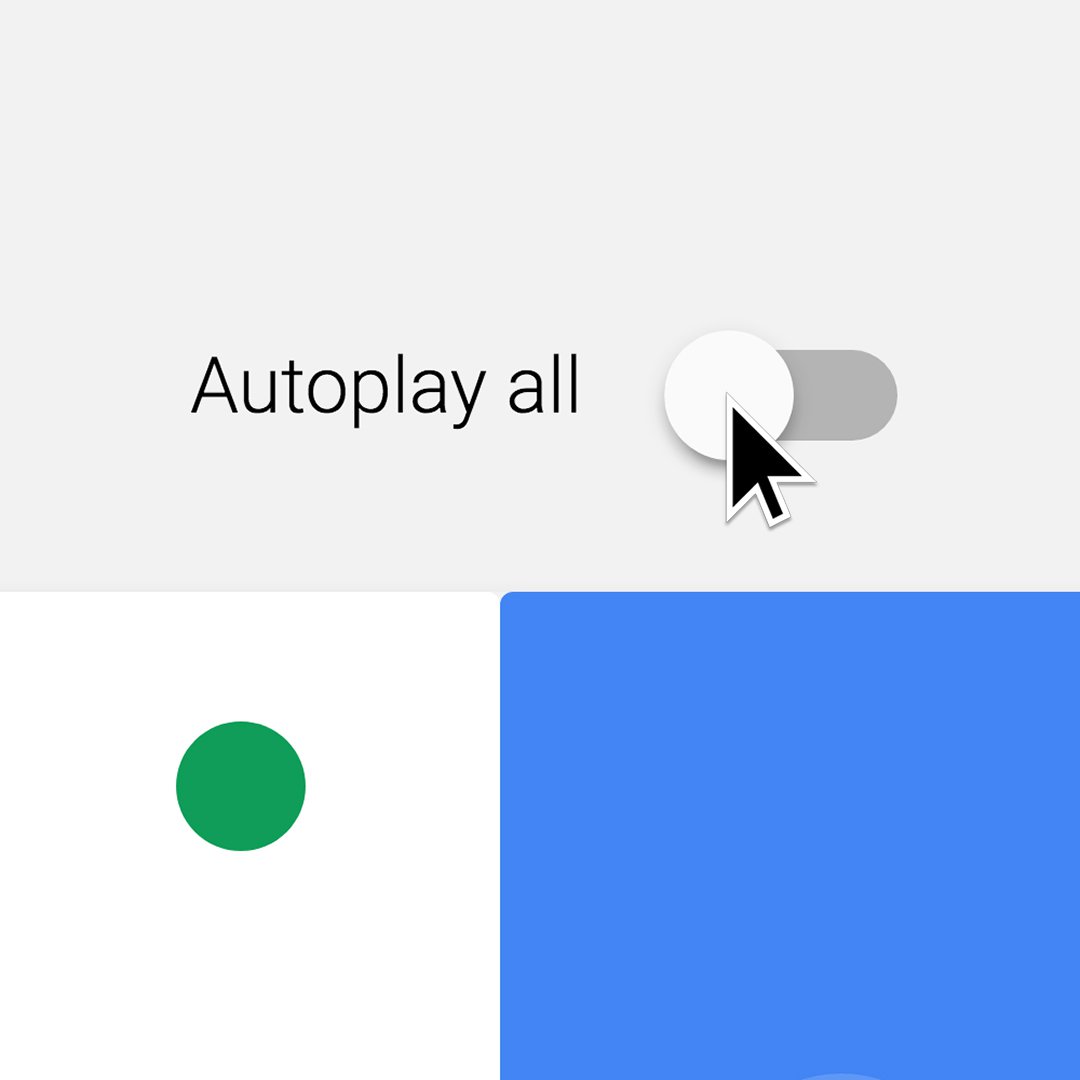
If you’d like to preview each segment or GIF separately, click Preview GIF with Autoplay All turned off and then hit the space bar to advance through each visual, step by step.
Download your GIF.
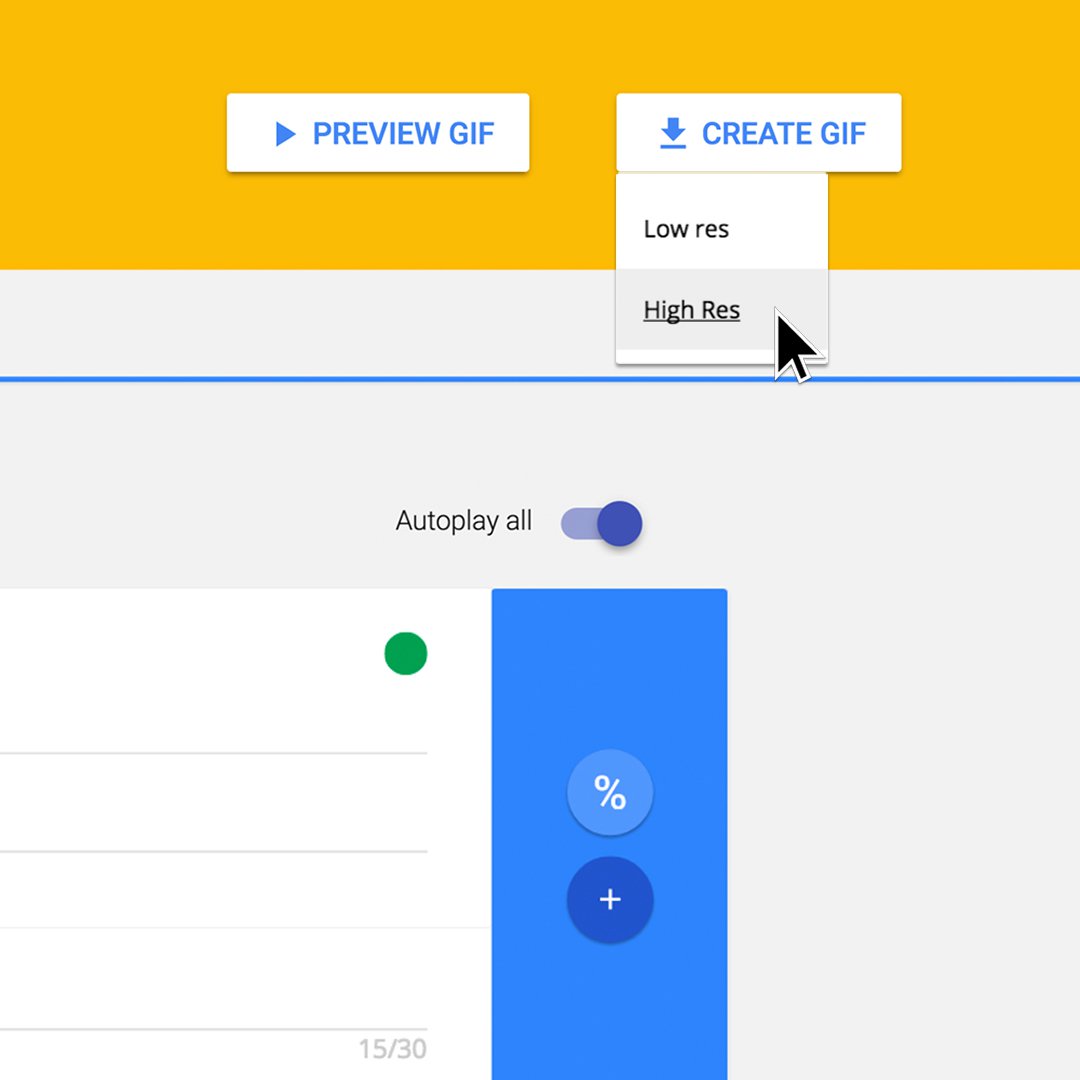
When you’re satisfied with your creation, click Create GIF.
When you’re satisfied with your creation, click Create GIF.
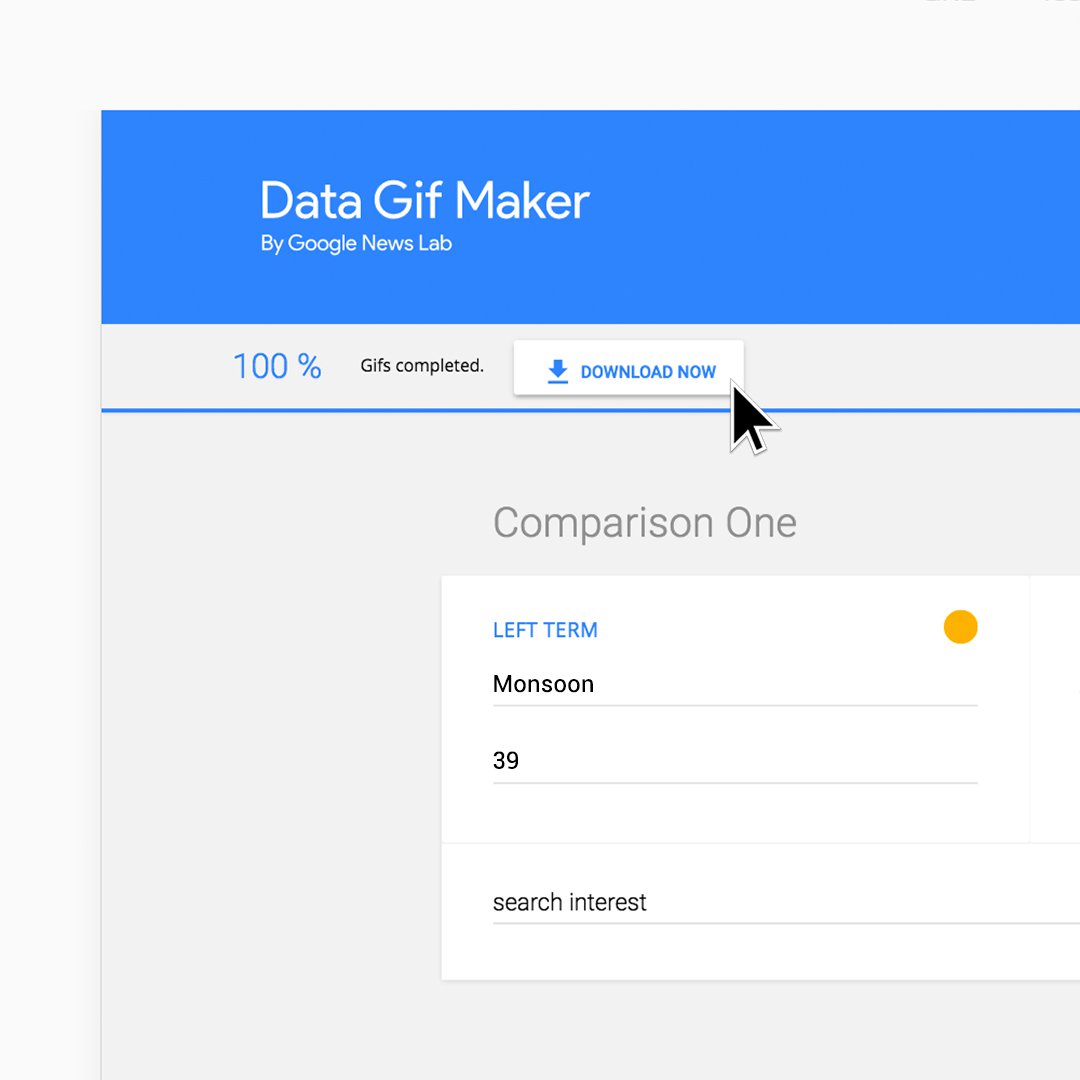
The high-resolution download may take a few minutes, but it provides better quality for social sharing. To speed up the process, we recommend that you leave your browser window open on your desktop while it’s creating the GIFs.
Once it’s 100%, click Download Now.
-
![GoogleTrends_AccessAWorldOfData]()
Public Data Explorer: Access a world of data.
LessonUse high-quality data sets to create compelling visuals. -
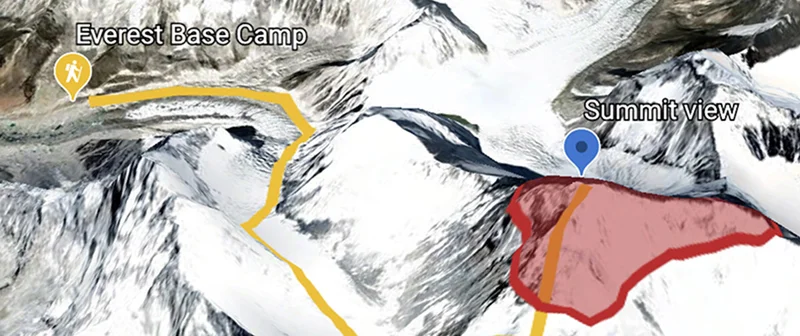
![GoogleEarthCreationTools_TellYourStoryAcrossTheWorld]()
Google Earth creation tools: Tell your story across the world
LessonHow to use Google Earth to create compelling stories -
![gni_business_lesson_play_3]()