


Public Data Explorer: Access a world of data.
Use high-quality data sets to create compelling visuals.
Find and visualise high-quality data.
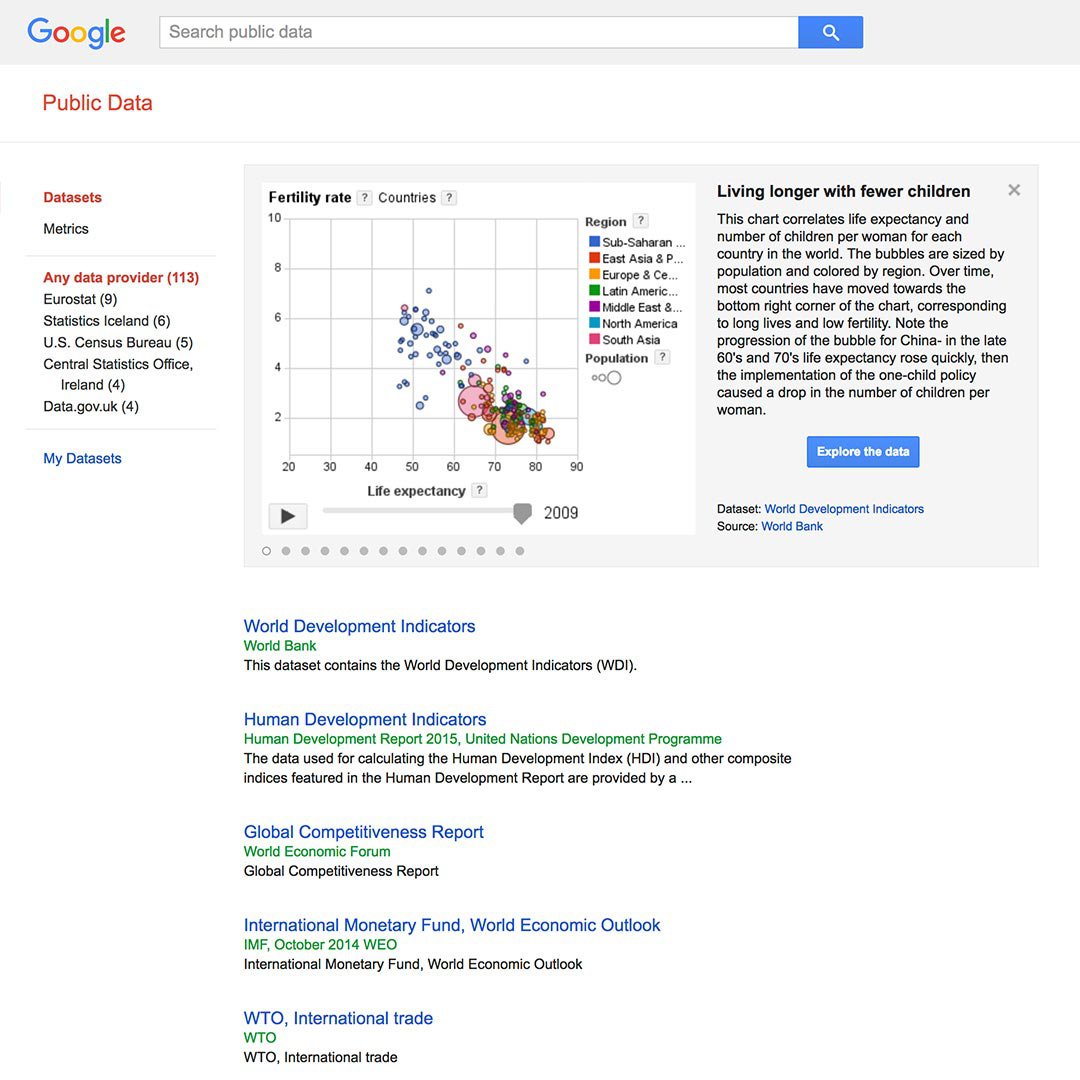
When you’re researching a story or on a tight deadline, finding quality datasets can be a roadblock. Google Public Data Explorer helps you find, interpret and share data to show how our world is changing.
It aggregates datasets from trusted sources and gives you simple tools to create sophisticated visualizations. With Google Public Data Explorer, you can monitor change over time, identify trends, compare metrics and strengthen your story using data.
Download the lesson PDF >
A single source for quality data.
With datasets from the World Bank, IMF, Eurostat and more, Public Data Explorer provides global statistics on the environment, economics, labour, health, education, poverty and more. You’ll also find more granular data from state and local governments, universities and nonprofits. So, whether your search is broad like “global CO2 emissions” or narrow like “high school dropout rates in Texas,” there’s a wealth of data to support your story.
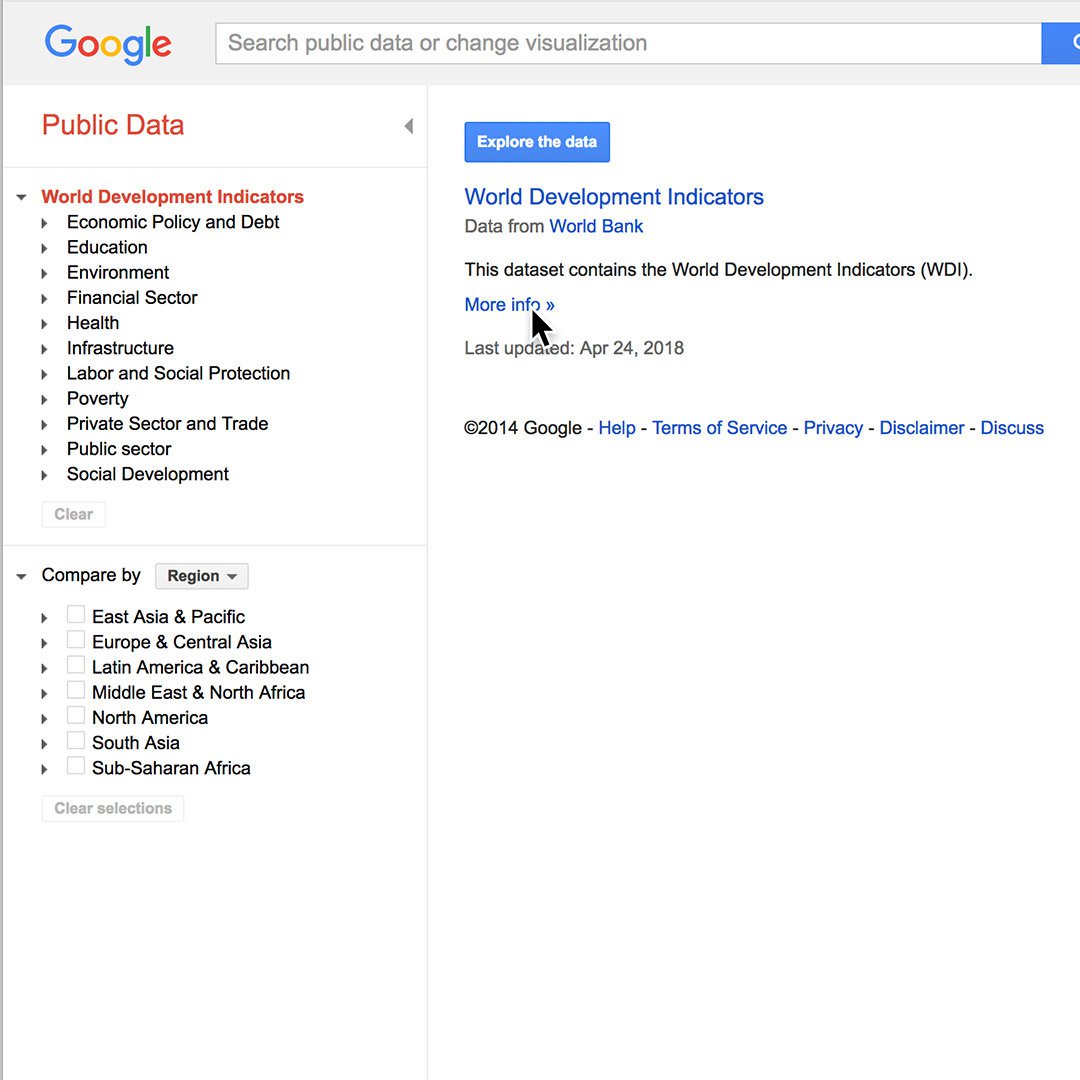
Public Data Explorer can also help you uncover new data sources.
To learn when the data was published and who created it, click the blue links.
To go to the site where the dataset is hosted, and look for different file formats, click More Info.
A library organised for fast, easy search.
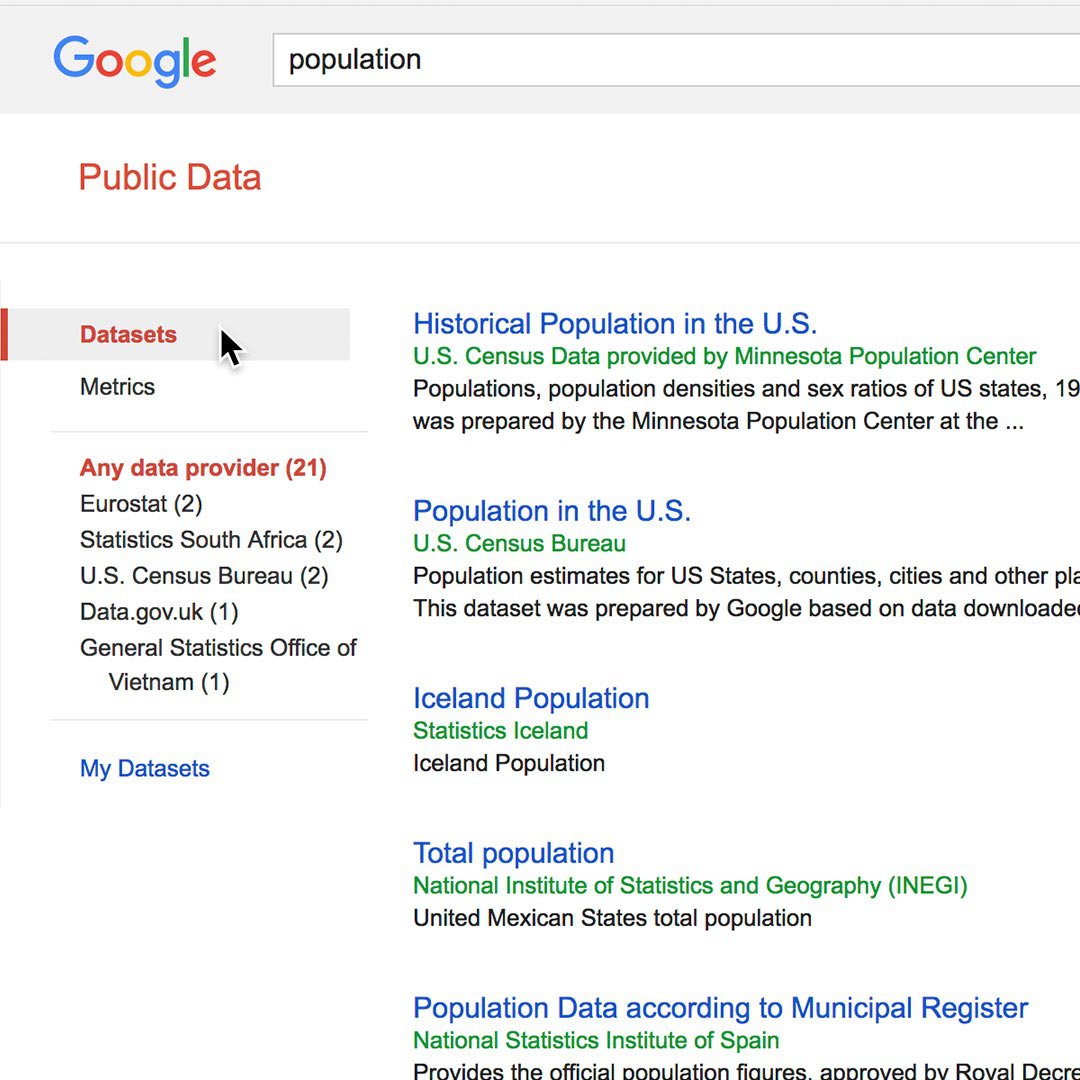
The Google Public Data Explorer helps you search datasets and metrics by keywords as quickly as you would with Google Search.
A Dataset is a bundle of statistics created by a single data provider. For example, "Population of the United States," from the U.S. Census Bureau, and "World Development Indicators," from the World Bank.
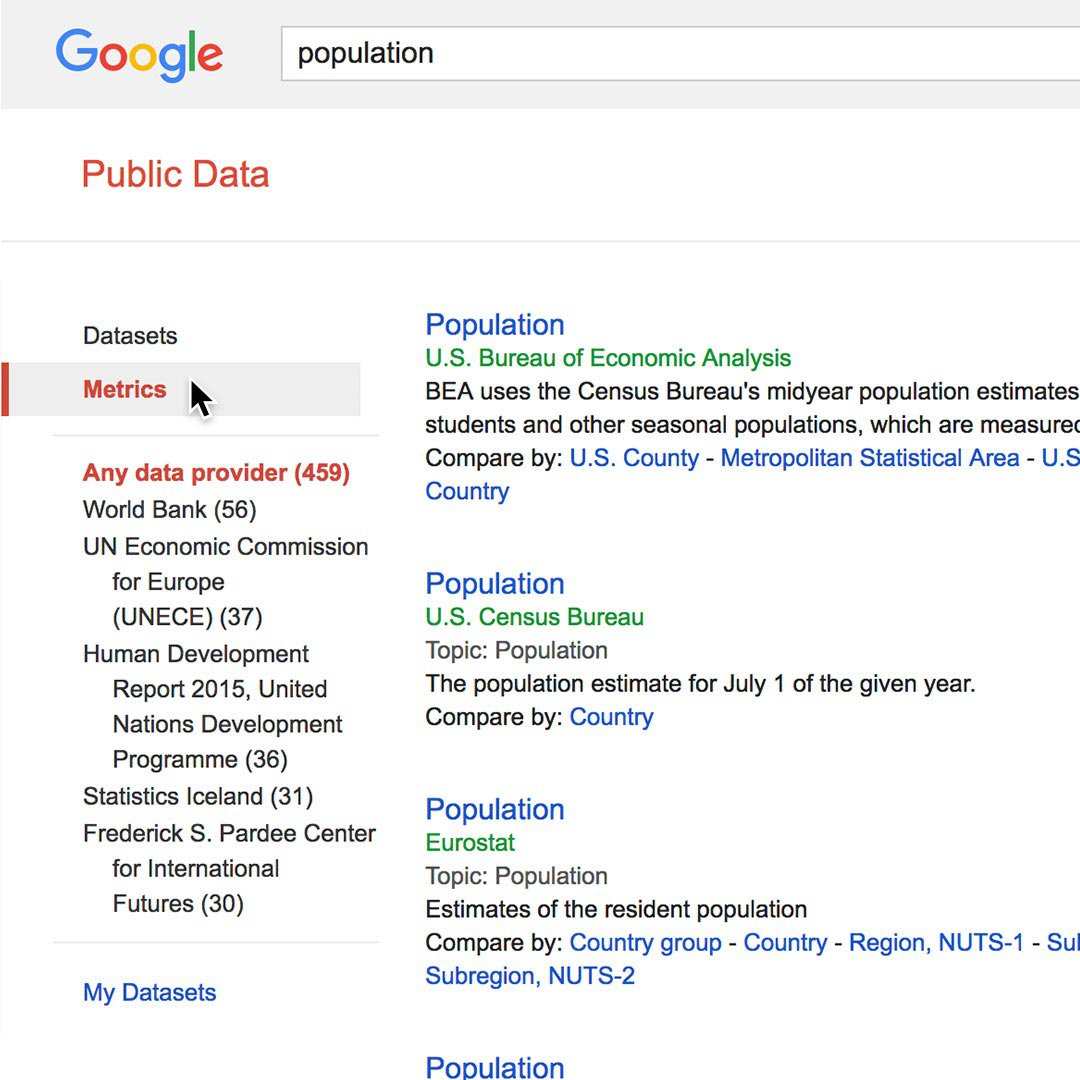
Metrics are statistics that are components of a larger dataset. These include topics like “population,” “unemployment rate,” and “GDP.” By default, search results appear in Metrics mode. You can switch modes by clicking Datasets on the left side of the page.
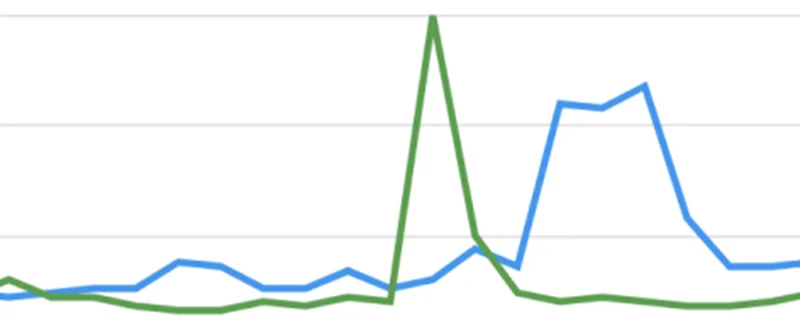
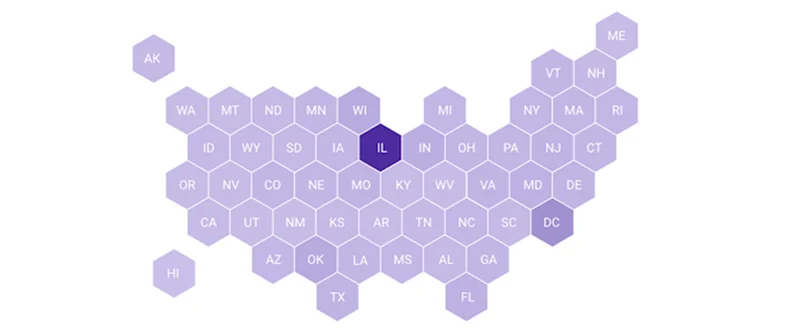
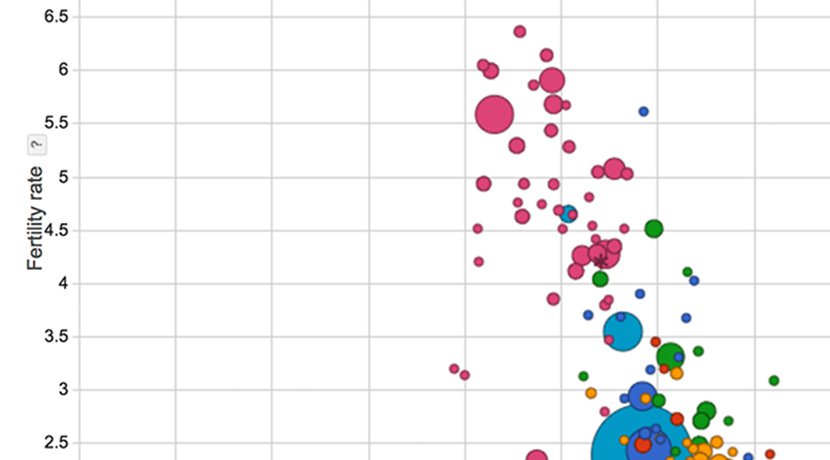
Tell your story through charts, graphs or maps.
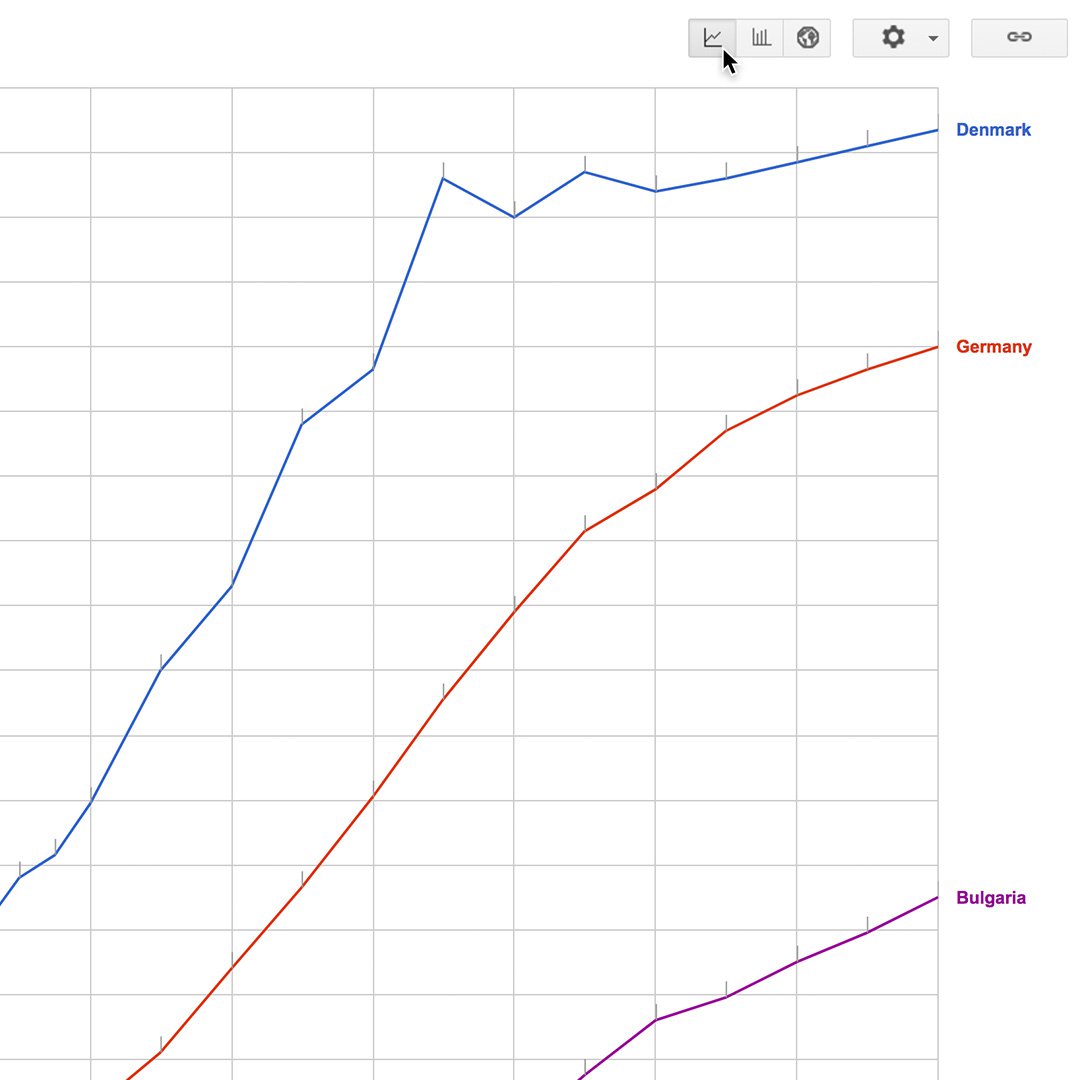
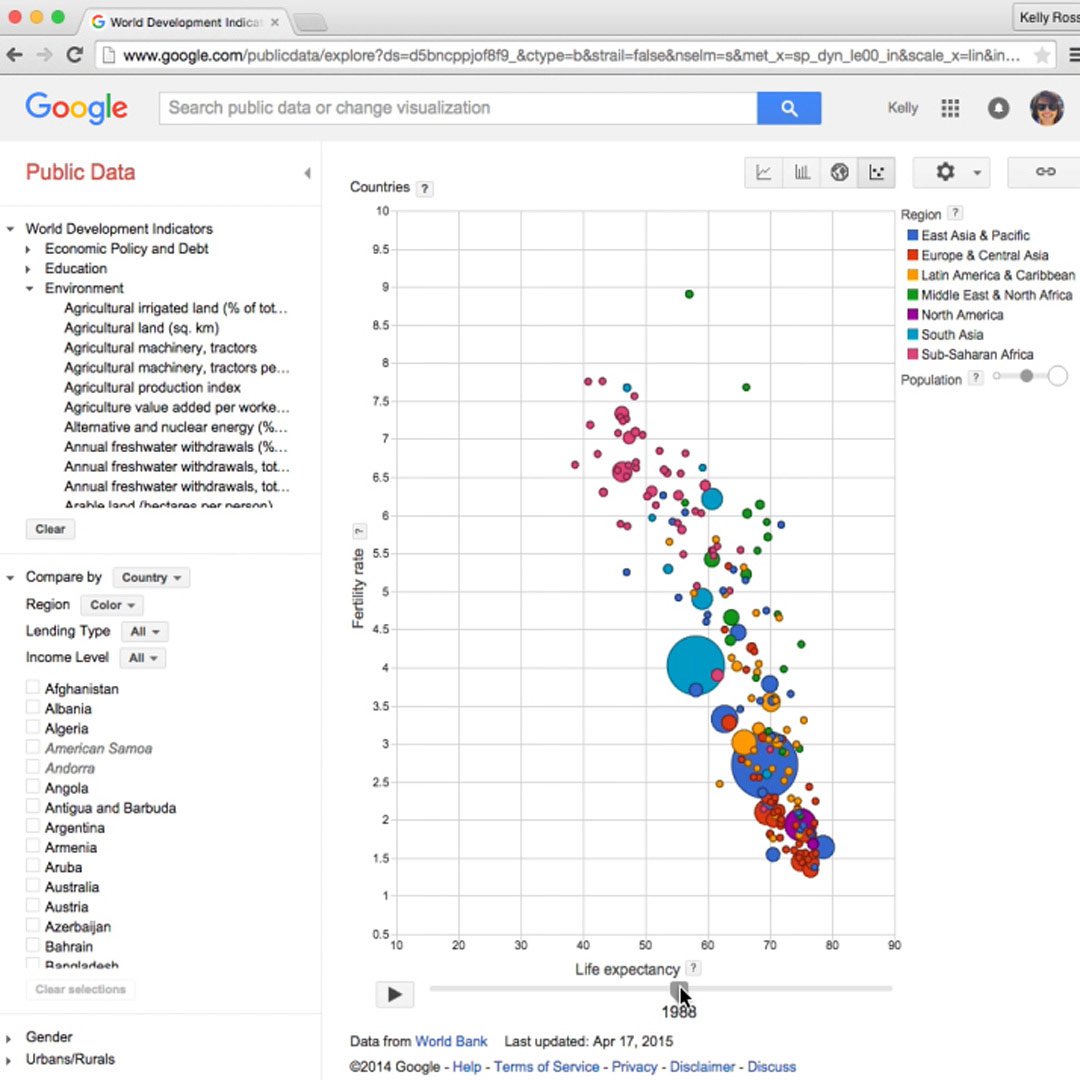
When it comes to statistics, visual representations can be powerful. In Google Public Data Explorer, the visualizations are dynamic, so you can watch them move over time, change topics, highlight different entries and alter the scale. You can easily publish a visualization with your story.
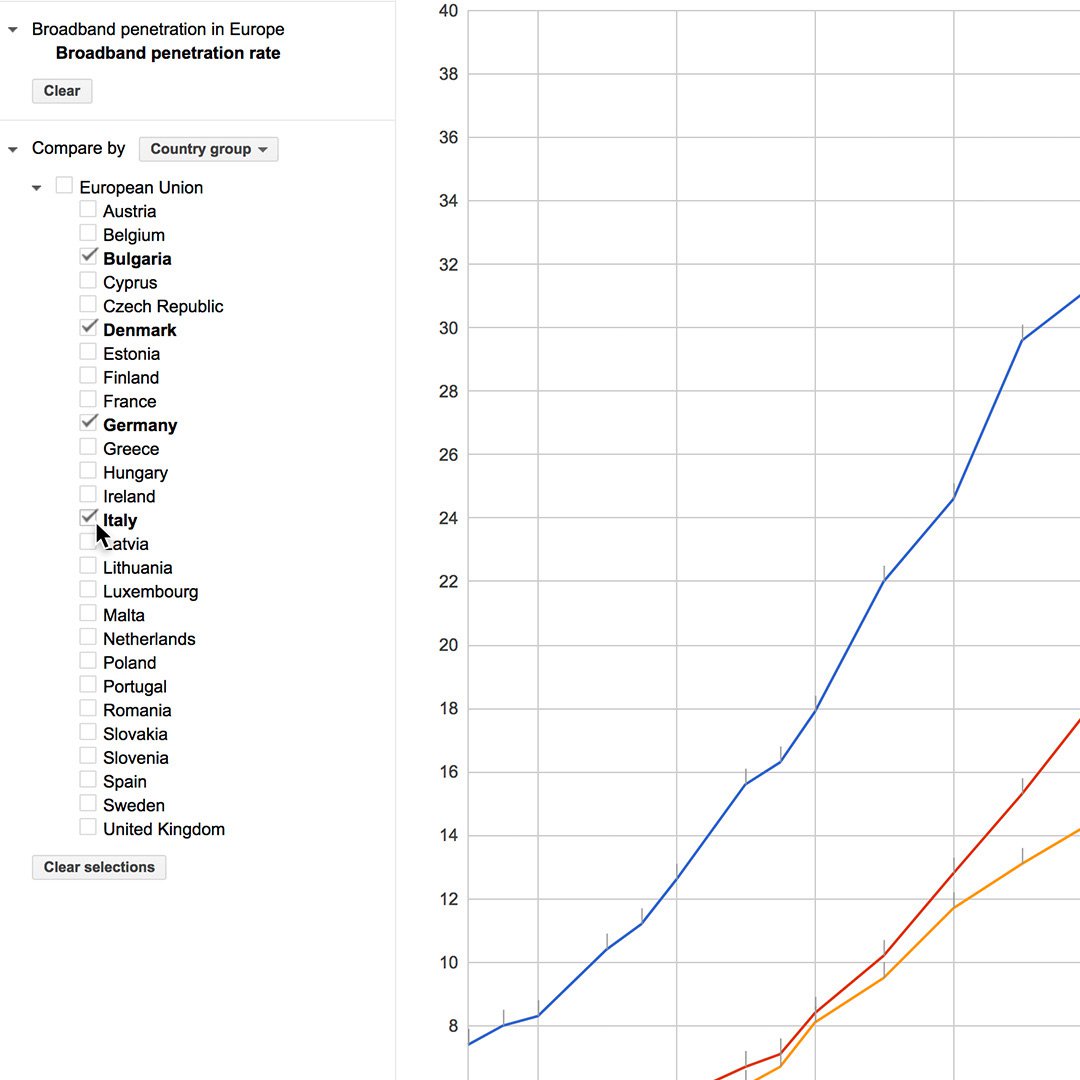
Select a visualization type (Line, bar, map, bubble).
Choose statistics to show, compare and filter.
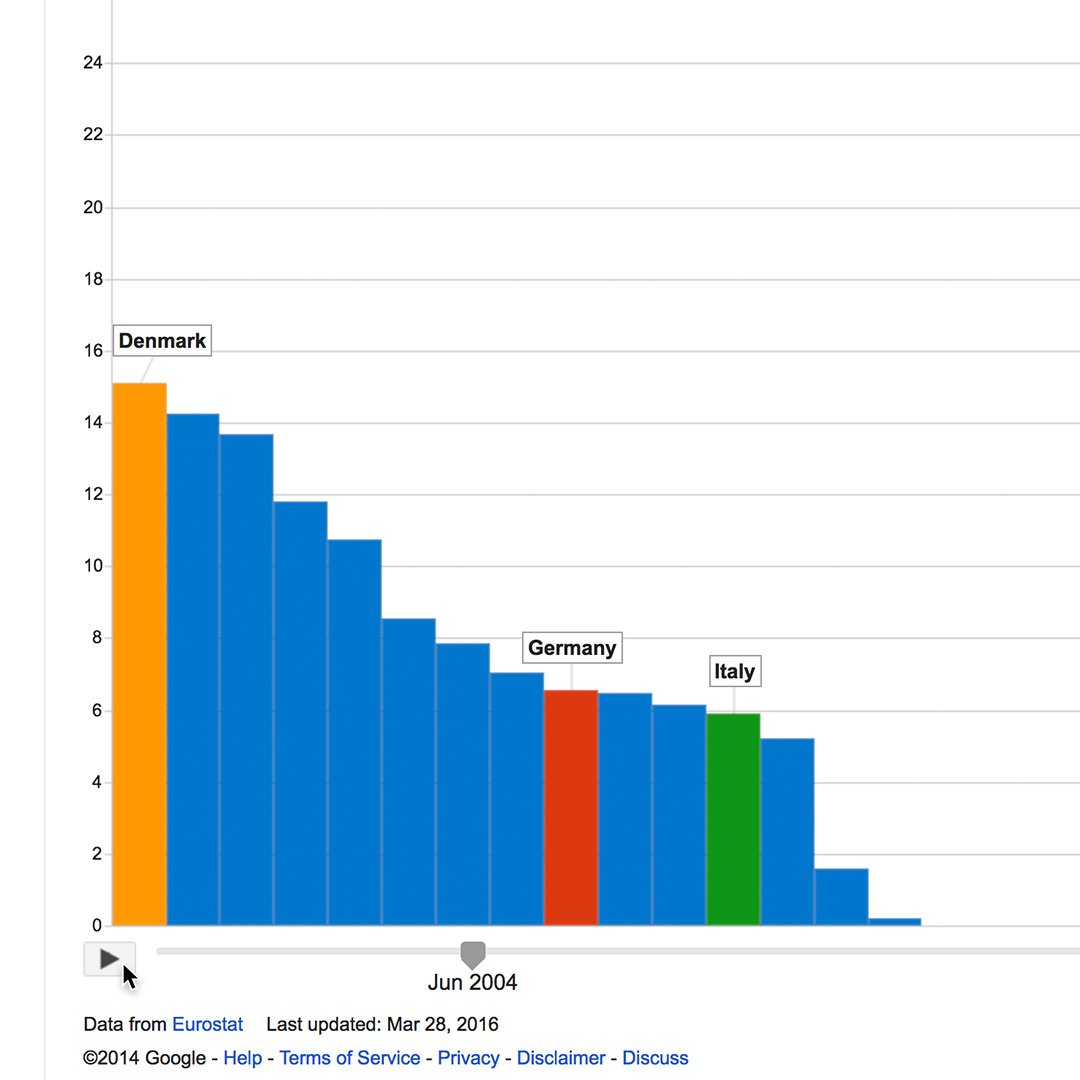
In a bar, map or bubble chart, click Play to animate it over time.
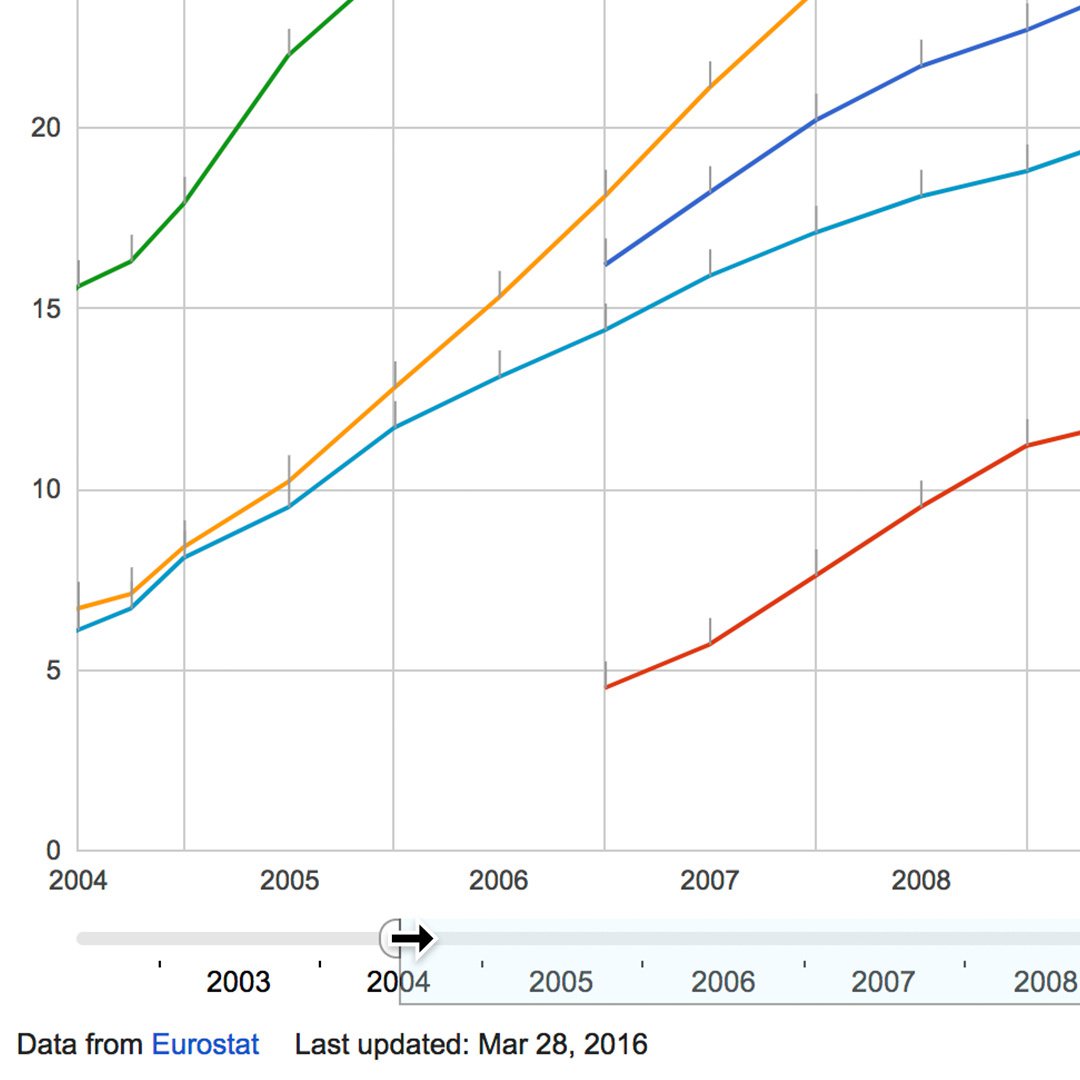
In a line chart, you’ll adjust the x-axis time range by sliding the tabs in the timeline.
-
![GO801_GNI_TranslationsOTG_TitleCard.jpg]()
Google Translate: Translations on-the-go.
LessonSpeak the language just about anywhere in the world. -
![BasicsOfGoogleTrends]()
Basics of Google Trends
LessonThis beginner’s course will teach you the basics of Google Trends, using the free Trends Explore tool. -
![GoogleTrends_SeeWhat'sTrendingAcrossGoogleSearch,GoogleNewsAndYoutube]()
Google Trends: See what’s trending across Google Search, Google News and YouTube.
LessonFind stories and terms people are paying attention to.